

Content Sections
- ● Navigating a deeply uncertain world
- ● How much of the world’s population is vaccinated?
- ● How well is it working?
- ● Is increased vaccination coverage associated with lower case rates and deaths?
- ● How death rates compare with the pre-‘pandemic’ era
- ● Who transmits more: vaccinated or unvaccinated?
- ● How dangerous is SARS-CoV-2 compared with other diseases?
- ● Familial/household transmission
- ● Snapshot take aways
- ● Subversion of the practice of medicine
By Rob Verkerk PhD, founder, executive and scientific director
Just as the word ‘unprecedented’ seemed to be the most used word in the first half of 2020, ‘uncertainty’ is fast becoming the most used term of the second half of 2021.
Navigating a deeply uncertain world
In a sea of great unscientific uncertainty, the last 18 months has been sufficient time for polarised views to become galvanised in people’s minds. This polarisation has been amplified by the skewing of research in favour of specific economic and political interests, and the marginalisation or censoring of dissenting scientific voices.
Another problem we all have trying to interpret what’s going on, involves the extreme variability of data and the dynamic nature of change. If you think there’s a plausible reason why something’s happening in one part of the world – such as rising case rates, hospitalisations or deaths – you’ll often find yourself scratching your head when you try to apply the same logic or mechanism to explain what’s happening in another. Such are the complexity of genetic, molecular and environmental factors driving the SARS-CoV-2-human interaction, on a backdrop of highly variable human behaviours and cultures, coupled with often contrasting regional and national policies.
Faced with such uncertainty and confusion, many – including so-called eminent physicians, scientists and influential political leaders – simply select those data that best fit their views. Yes, it's cherry-picking. When you see a trend that appears to highlight the potential failure of a given policy – such as mass vaccination – chances are you’ll find the next tranche of official data is delayed or shows up in a different format, preventing you from comparing ‘apples with apples’.
"That means the vaccine doesn’t do what most people think, namely stop or reduce transmission between humans." - Rob Verkerk PhD

Don't think it's only 'the other side' who're doing it. Many of us who are vehemently opposed to global mass vaccination do the same thing. We're programmed for survival and we're all looking for justifications to explain the world around us, the decisions we make and the positions we hold.
As a non-profit that has followed an approach we call 'good science' and 'good law', now for nearly 20 years, we have to pinch ourselves regularly to check for bias. Readers who don't like what I'm about to write will no doubt hold me accountable to my own biases. Please offer your comments should you have such concerns - as I'd like to hear them. Being open to criticism is part and parcel of trying to do 'good science'.
For what it's worth, here's a prediction: not so far in the future, historical accounts of the current era will likely point to lack of transparency of raw data on which government policies were based as a major reason for the unnecessary suffering, deaths and collateral damage that would last more than a generation. But only time will tell.
In an effort to avoid obvious biases – I've attempted here to look at a wide range of existing data to answer some questions many are asking – acknowledging their shortcomings as most are from official sources – to give us a snapshot of the current status of this so-called ‘pandemic’.
How much of the world’s population is vaccinated?
Ever since the ‘pandemic’ broke in March 2020, novel, synthetic biology vaccines, based on synthetic mRNA and non-replicating viral vector technologies, were hailed as the best exit strategy. They were the heavy artillery to follow attempts to reduce transmission using national lockdowns, social isolation and masking.
With a stated intent of achieving “vaccine equity”, countries – such as the majority in sub-Saharan Africa – that have never had a discernible SARS-CoV-2 problem, are still being pushed to vaccinate at least 40% of their populations. Currently, according to official figures collated by Our World in Data, while 46% of the world has received at least one dose, only 2.3% of people in low-income countries have had at least one dose. Global roll-out has meant nearly 6.4 billion doses have been administered, at a current and staggering estimated rate of 23.6 million shots per day.
Visually, using Our World in Data with its inevitable limitations, it looks like this (Fig 1):
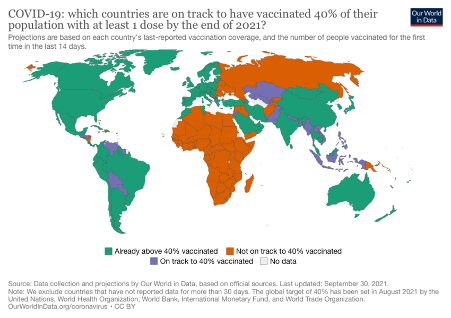
Figure 1. Global coverage below and above the targeted minimum threshold of 40% injected.
If you want to see progress of the global mass vaccination program by country (selected to show the huge range), check out Figure 2.
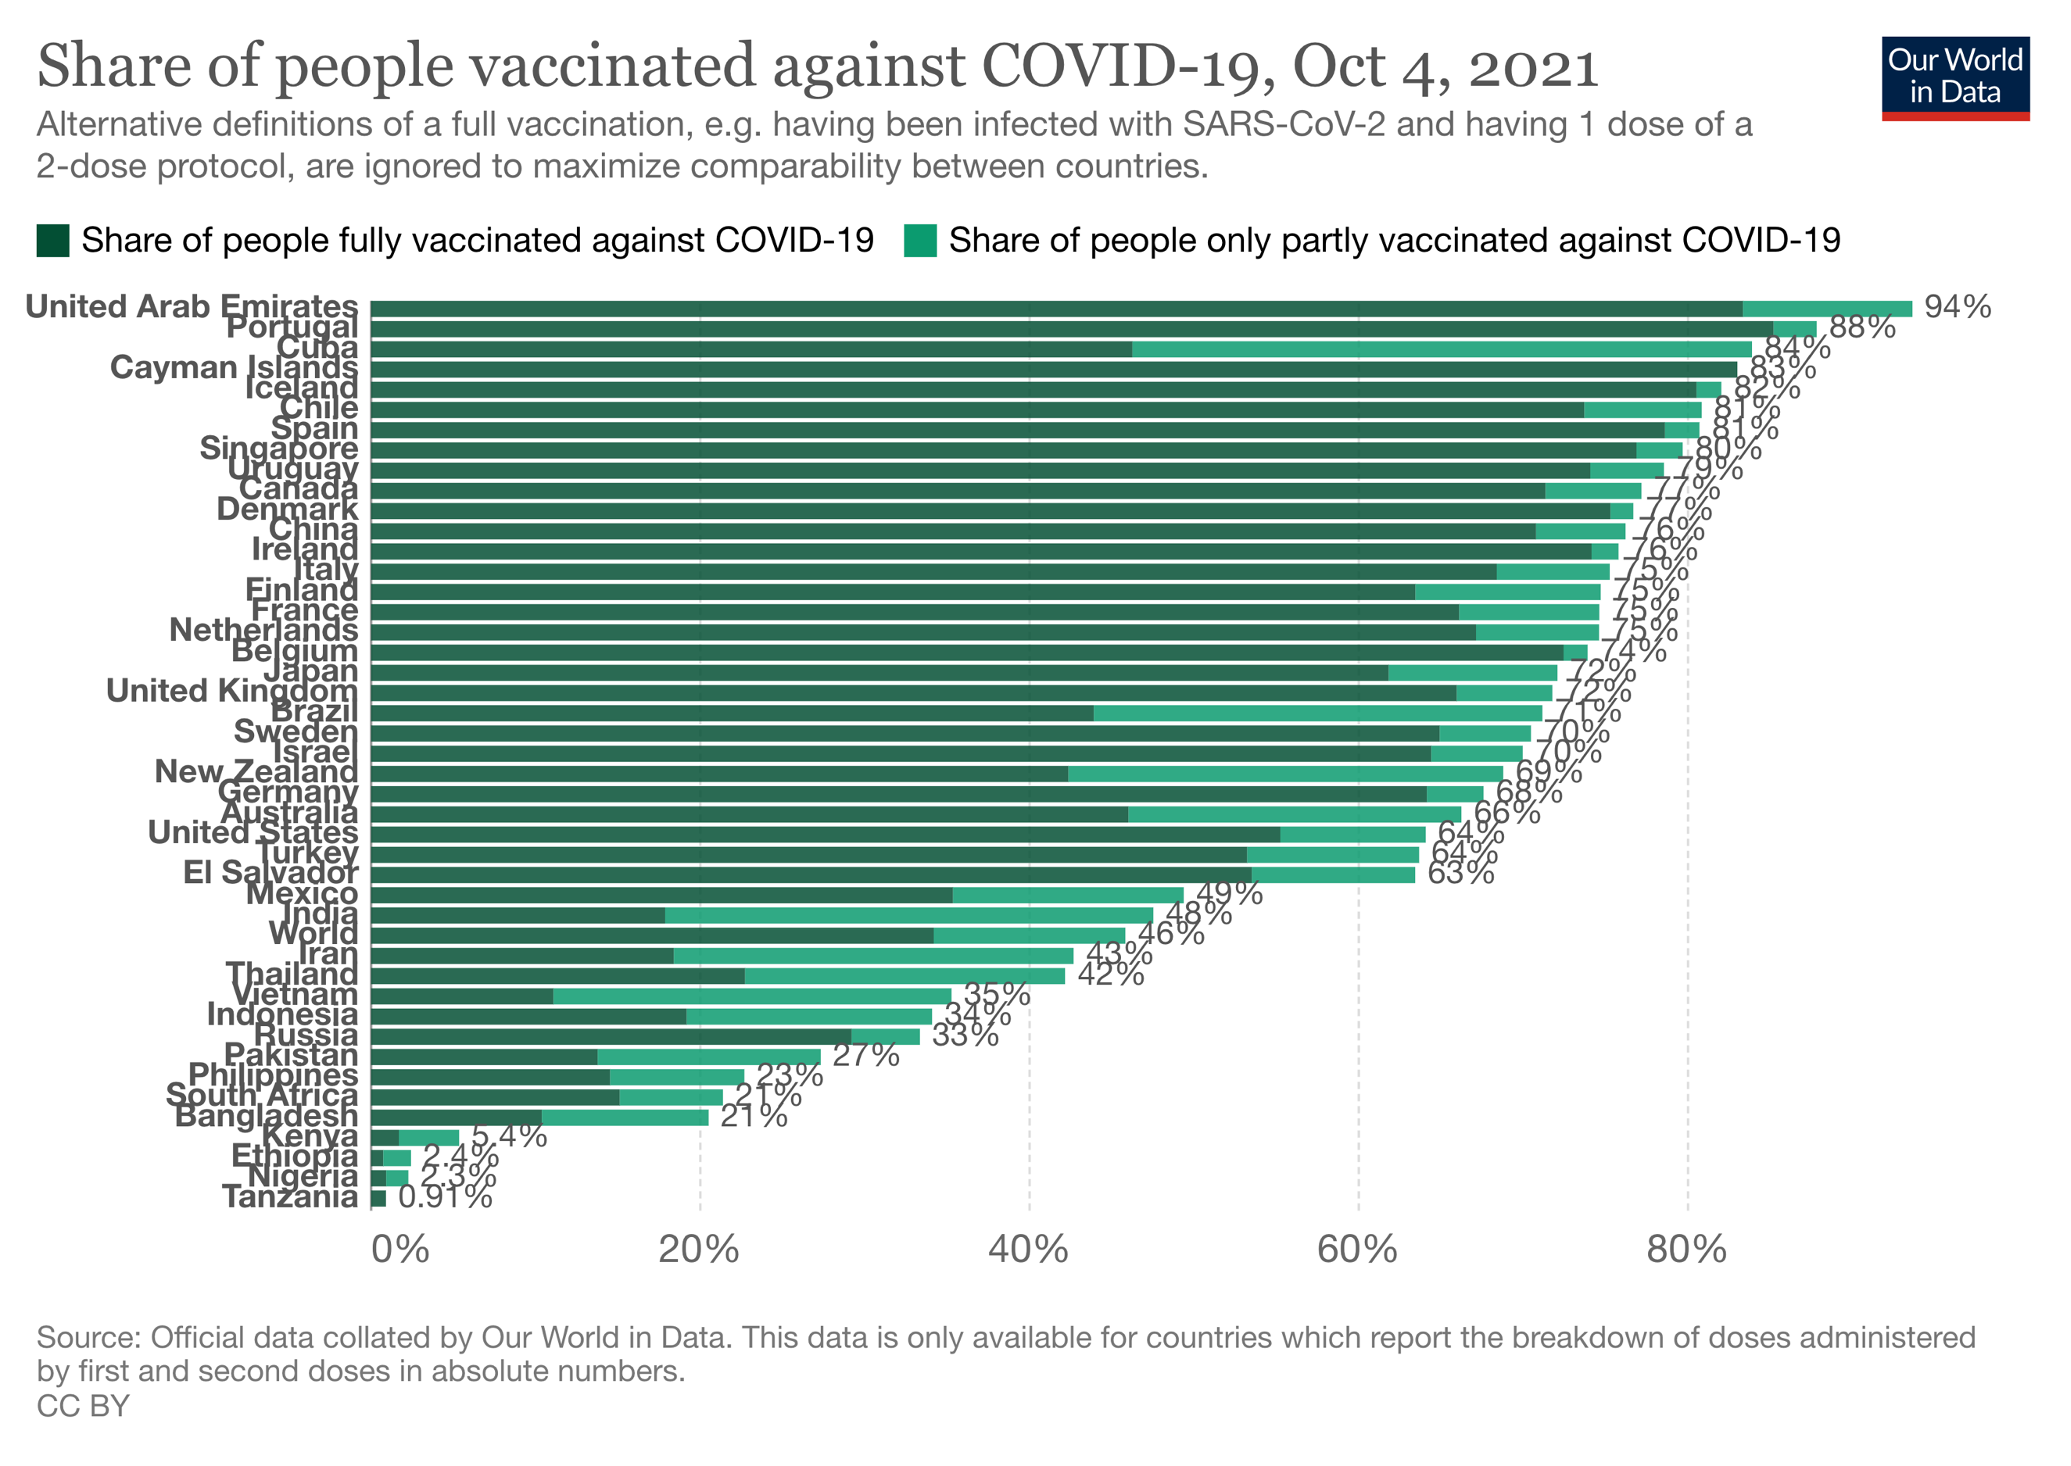
Figure 2. Percentage of populations from selected countries partially and fully covid-19 injected.
How well is it working?
You’ll recall the preliminary reports from national vaccination campaigns reported “astonishing high levels of protection against disease”, well in excess of 90% claimed vaccine effectiveness – figures that were previously almost unheard of for more conventional vaccines.
That’s much less the case today as the delta variant has become the dominant circulating variant in many countries.
The US Centers for Disease Control and Prevention (CDC) in the USA continues to position the injections as ‘safe and effective’, while acknowledging that there have been 22,115 breakthrough infections that led to hospitalisation or death. That’s after more than 183 million people in the US have been vaccinated. This rate (0.012%) of course isn’t the true breakthrough infection rate, it only includes breakthroughs that have included severe consequences, that may include both disease and adverse reactions to the injections.
Leaked summary data from health data company Humetrix – revealed by Ohio-based attorney Thomas Renz – show, among a sub-cohort of 5.6 million, Salus cohort of over-65 Medicare beneficiaries which is “80% fully vaccinated”, a progressively declining vaccine effectiveness against infection as the delta variant became dominant between mid-May and mid-August 2021. Vaccine effectiveness is estimated now at just 41% and presumably will drop further.
This rapid change in dynamics would suggest any data analysis before this time should not be applied to populations exposed predominantly to the delta variant. Yet every day in the media we hear assertions from governments, health authorities and other policy makers that draw on findings from now irrelevant data.
The Humetrix summaries surmised that “an estimated 60% of COVID-19 hospitalizations occurred in fully vaccinated individuals in the week ending August 7th”.
More concerning was that 71% of covid-19 cases were reported as breakthrough infections in the first week after the delta variant comprised more than 90% of infections (in the first week of August). Also, from the end of July, the breakthrough infection rate was found to be significantly greater for the Pfizer than Moderna vaccine.
Data on outcomes following confirmed delta variant infection in England and Wales released routinely by Public Health England, compare hospitalisations and deaths in vaccinated and unvaccinated populations.
We have summarised some of the key data in Table 1.
Table 1. Summary data derived from Public Health England Technical Briefing 23, from 1 February 2021 to 30 August 2021
|
Hospitalisation (with at least |
Case fatality rate (%) |
|||
|
Fully vaccinated |
Unvaccinated |
Fully vaccinated |
Unvaccinated |
|
|
Under 50 |
0.84 |
1.81 |
0.06 |
0.05 |
|
Over 50 |
5.44 |
20.89 |
2.17 |
6.90 |
|
Total |
2.94 |
2.45 |
1.03 |
0.28 |
While the data reveal substantially higher hospitalisations and deaths among the unvaccinated compared with the fully vaccinated in the over-50 age group, this difference is markedly less in the under-50s. More importantly, while there are more deaths reported "with covid" among the unvaccinated over-50s, this is confounded by the fact that many older people are dying of comorbidities who have also tested positive for covid within the last 28 days.
Most importantly, in the under-50s, there is no reported increase in fatality rate among the unvaccinated - in fact, quite to the contrary: mortality is slightly less among this younger, unvaccinated group, as compared with those fully vaccinated. It is also likely, given the very low mortality rates, the vast majority of these deaths are not caused directly by SARS-CoV-2 infection.
These data do not justify the extreme and coercive pressure for the jabs being applied to the under-50s in England and Wales, and the UK generally. This is even more astonishing given the decision by the UK’s Joint Committee on Vaccinations and Immunisations (JCVI) to not recommend, in early September, in favour of a “universal programme of vaccination of otherwise healthy 12 to 15-year-old children at this time.”
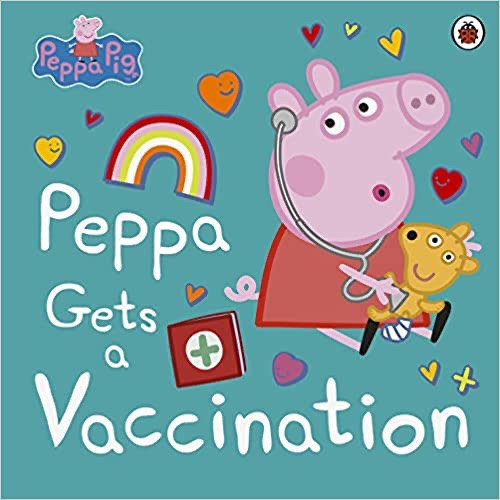
The latest Peppa Pig book (Ladybird, paperback £6.99, Kindle £4.99) - on sale on Amazon. Published on 30 Sept 2021; is this timing coincidental with a general push for encouraging reliance on vaccinations by families? Action: Would you like to leave a review on Amazon?
Is increased vaccination coverage associated with lower case rates and deaths?
While closely related to the previous question, understanding the relative outcomes of vaccinated and unvaccinated populations is particularly important given the need to justify the very high cost to society of publicly indemnified mass vaccination programs. Especially given the coercion being metered out to citizens over this novel and largely experimental form of medical intervention, that is also contributing to significant adverse effects among those injected (see more about this in next week's feature). One of the challenges we face is that there is no easy way to establish a causal (or otherwise) link between vaccination data and hospitalisations or deaths. The publicly available reported data, and even the death certificates in most countries, do not contain sufficiently detailed or reliable information.
This difficulty aside, it would seem that, given that in many parts of the world we’re 9 months into the mass vaccination programme, evidence of widescale effectiveness of a vaccination programme would reduce covid-19-related deaths or hospitalisations (depending on the extent to which severe disease was prevented), as well as cases (depending on the extent to which transmission was reduced).
Our preliminary collation of the most recent data (up to October 4, 2021) – shown in Figure 3 – includes covid-19-related deaths and cases from the most heavily vaccinated countries in the world. The data are derived from two sources both relying on official data: Our World in Data provides the current vaccination rate and Worldometer provides the case and mortality rates, both of these being per capita (per 1 million population).
As with any preliminary data exploration, one might expect to see patterns reflecting either positive or negative associations. A pattern many would expect would be a positive association between the extent of vaccine coverage and reduced case rates. This wasn't evident to us (Fig. 3). In Figure 4, we collated the same parameters for some additional countries of interest. Again we don’t see a pattern. If you were to only look at UAE, Cayman Islands, Iceland and Singapore in Figure 3, or China in Figure 4 - it all looks good. But broaden your country search and the association appears to fall apart.

Figure 3. Comparison of SARS-CoV-2 infection cases with covid-19-related deaths per 1 million population for the world’s most intensively vaccinated countries. Blue bars = cases/1 million population; Green bars = covid-19-related deaths per 1 million population. Lozenges above bars = percentage of the population fully vaccinated. Source data: Our World in Data, Worldometer.
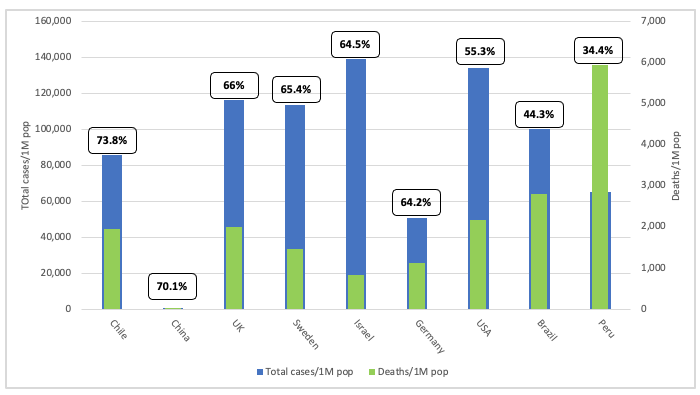
Figure 4. Legend as for Figure 3, but showing data for selected countries with variable vaccination coverage.
A trawl of the literature found a paper on this very issue, also using datasets from Our World in Data (nearly everyone is reliant on the same data sets). Lead author of the study, published on September 30 in the European Journal of Epidemiology, was Subu Subramanian, Professor of Population Health and Geography at Harvard University. The title tells you what’s in the can, “Increases in COVID‐19 are unrelated to levels of vaccination across 68 countries and 2947 counties in the United States”.
Talking of snapshots, Subramanian and co-author Akhil Kumar, plotted cases just in the last 7 days against population vaccination rates and also found no discernible relationship, at least not in favour of a positive effect on vaccination.
They wrote, “the trend line suggests a marginally positive association such that countries with higher percentage of population fully vaccinated have higher COVID-19 cases per 1 million people. Notably, Israel with over 60% of their population fully vaccinated had the highest COVID-19 cases per 1 million people in the last 7 days.” This figure is shown below, in Fig. 5, and the trend line is the grey straight line suggesting a slightly positive relationship between vaccination intensity and cases in the last 7 days.

Figure 5. Relationship between cases per 1million people (last 7days) and percentage of population fully vaccinated across 68 countries as of September 3, 2021.
They then conducted sensitivity analyses for both countries and states and counties of the USA – also incorporating a one month lag to take into account any delay in development of immunity (considered to take around 14 days) – and still found no association.
It’s unquestionably a time for a rethink – or do the vaccine proponents think boosters will set the program back on course. We worry that it may have the exact opposite effect, in recognition of the warnings issued to deaf policy makers by vaccinologist Geert Van Den Bossche.
The data now in front of us make assertions that the unvaccinated are the primary threat to the vaccinated by the likes of high-profile and influential scientists like Emmanuel Goldman seem excruciatingly short-sighted.
How death rates compare with the pre-‘pandemic’ era
The same caveat applies to data on deaths as I mentioned above; covid-19-related deaths don’t mean covid-caused deaths. In fact, the longer this ‘pandemic’ drags on, the more complex the causes of death are likely to become, owing to reduced healthcare access and effectiveness, along with the effects of depression and chronic stress mediated by the very difficult conditions such as loss of livelihoods and relationship breakdowns that so many are enduring.
Worse than that, the ‘pandemic’ could be made to run indefinitely if governments continue to rely on PCR tests to determine cases (as compared with cases of symptomatic infection). That’s because Bayes’ theory means that as true infection rates start approaching zero, ‘cases’ detected by PCR and other molecular tests will appear to rise substantially owing to false positives).
One way of looking at the threat of an infective pathogen is to see how it behaves in highly urbanised environments with populations that are known to be intrinsically susceptible. New York City likely fits that bill. So it was interesting that out of 15,230 confirmed deaths in New York City up to May 12 (as the Delta variant was beginning to take off), only 690 (4.5% of all deaths) occurred in patients under the age of 65 who did not have an underlying medical condition (or for which it is unknown whether they had or did not have an underlying condition).
But let’s get a bit more big picture. As we’ve explained before, we get one of the best handles on a pandemic’s impact on mortality by looking at 'excess deaths' – those deaths over the expected death rate, usually based on the average over the previous years.
Looking at the most recent snapshot from EuroMOMO (29 participating countries, principally in Europe, but including Israel and Ukraine), we can start to see what we think is a disturbing trend in the 9 complete months of 2021. We’ve pulled off from the 'graphs and maps' section of the EuroMOMO site, in Figure 6, mortality rates for each of the 52 weeks of 2019 (grey line), 2020 (dark blue line) and 2021 (light blue line). The graphs for the age groups most susceptible to covid-19, 75 years and older (i.e. Fig. 6, graphs F to H), reflect expected greater excess mortality in 2020, compared with 2019 and 2021, during the first two waves. These waves were seen as distinct spikes in excess mortality, as measured by z-scores, a well recognised measure of excess mortality (see ‘Z-scores by country’ at the base of the graphs and maps page of the EuroMOMO website).
However, in 2021, for the 15-44 years (that have very low risk of death from covid-19), as well as the 45-64 year and 65-75 year age groups ( Fig. 6, graphs C, D and E, respectively), we see an alarming increase in excess mortality for 2021. This is all the more disturbing as significant excesses in mortality in 2021 for all age groups is only evident in a very small number of countries, notably Hungary, Ireland, Portugal, Spain and England (see Z-scores, section of EuroMOMO website), representing a small minority of the total EuroMOMO population.

Figure 6. Excess mortality data from EuroMOMO for a range of different age groups.
The two most obvious factors contributing to this excess mortality in younger age groups in 2021 are likely:
- Mortality associated with the delta variant which tends to infect younger people more readily than the alpha variant
- Indirect and collateral effects of the pandemic
However, direct and indirect effects associated with vaccination cannot yet be discounted given the likelihood of the underreporting of adverse events, as well as the potential for antibody-dependent enhancement (ADE) and immune disturbances (including autoimmunity).
Who transmits more: vaccinated or unvaccinated?
In a study on breakthrough infections published (as a preprint) in The Lancet, the delta variant was shown to be passed readily between healthcare workers in a Vietnamese hospital some 2 months after being injected with the AstraZeneca vaccine. The viral load in the breakthrough delta variant cases was found to be 251 times (25,100%) greater in fully vaccinated workers than in those infected with the original Wuhan strain. Neutralising antibody levels were also found to be low in infected and injected individuals, explaining why transmission occurred so readily during the 2-week period of the study.
A recent publication on the preprint server MedRxIV by a team at Oxford University confirmed an ever more common finding: that viral loads of delta variant infections were similar irrespective of the vaccination status of the individual. That means the vaccine doesn’t do what most people think, namely stop or reduce transmission between people. The sole remaining purpose of the injections is therefore as treatments to reduce the severity of infection – and in that case they should be compared against other treatments, especially early treatments such as those including ivermectin.
"The vast majority of doctors are paralysed by the authoritarian system in which they now find themselves. They risk their livelihoods and careers if they speak out. Perversely, they are forced to sideline the four pillars of medical ethics that are central to good medical practice." - Rob Verkerk PhD
Not only that, like much of the emerging data, the study found that both the Pfizer and the AstraZeneca vaccines suffer waning effectiveness over time, especially now the delta variant is dominant. After 12 weeks there was no benefit in terms of reducing transmission.
This compares with natural immunity, in which, says Shane Crotty from the La Jolla Institute in an article in Science magazine, “immunological memory to SARS-CoV-2 has been observed for more than 8 months for CD4+ T cells, CD8+ T cells, memory B cells, and antibodies, with a relatively gradual decline that appears to partially stabilize within a year.”
How dangerous is SARS-CoV-2 compared with other diseases?
A useful measure of the deadliness of an infectious disease is its case fatality rate (CFR) or infection fatality rate (IFR). It refers to the proportion of people who die primarily as a result of the confirmed infection. The trouble is that, historically for other diseases, cases have been defined as 'cases of symptomatic disease', not just 'cases of positive molecular tests'. Uniquely, with the roll out of mass molecular testing including PCR and lateral flow, reported ‘cases’ of covid-19 are not just symptomatic cases, they are cases of positive test results, including those who are asymptomatic and those who've had false positive test results. In short, the reported ‘covid-19’ cases are not directly comparable with other diseases.
But as always, it is better to explore the available data than to ignore it. As it happens, a comprehensive list of case fatality rates has been created in Wikipedia. It lists SARS-CoV-2 in a rather lowly 54th place, with a case fatality rate of 1.6%. That puts it below HIV/AIDS, tuberculosis, dengue, typhoid, pertussis (whooping cough), measles in developing countries, and hepatitis A.
This Wikipedia quoted fatality rate is crude and does not take into account the necessary adjustments, as argued by Stanford's John Ioannidis, the world most published scientist, who proposes a global case fatality rate for SARS-CoV-2 at around one-tenth of the Wikipedia estimate – just 0.15%.
If that wasn't enough, the UK government does not rate SARS-CoV-2 as worthy of being considered a ‘high consequence infectious disease’ (HCID).
Familial/household transmission
Household transmission is the most important kind of transmission, especially while populations have been forced to reduce community transmission through social distancing and related measures. However, there is an overwhelming body of evidence showing that younger people and children are not only less likely to become ill, they are also less likely to be infected than older people. Households with more than 3 people have lower secondary transmission rates than those with only two people. This is at least in part a function of probability (if the virus only has one host to infect as opposed to 4 or 5....you get the picture).
Different studies have revealed different estimates of transmission risk or secondary attack rate. A study published in JAMA Network Open in February, prior to the delta surge, showed a transmission risk of just 10%. This contrasted with a Wuhan study published in The Lancet which estimated the secondary transmission rate at 15.6%. A Swiss study published in Nature found transmission to approximate to a 1 in 6 risk (17.3%). The UK Household Transmission Evaluation Dataset (HOSTED) found that household transmission (based on diagnosed secondary cases) in England between June and September 2020 ranged between 4 and 6.4 per 100 household contacts.
For children, transmission risk is much lower again. Secondary attack rate (SAR) estimated in children in Korea was found to be just 0.5%.
All this explains why many of us are aware of multiple cases in which infected individuals who’ve been sharing beds under the same roof have often failed to pass on infection.
More than that - absent from the public narrative is that transmission to healthy people with robust immune systems, is likely the best exit strategy we could have from this. Sadly, irrespective of the science, you won't hear those deeply invested in the global vaccine supertanker wanting to change direction any time soon.
Snapshot take aways
Our assessment of the available data raises a number of important points:
- There is now an ever increasing amount of data to suggest that the global mass vaccination program is failing, especially as the delta variant
- In particular, the vaccine does not appear to stop transmission and, more disturbingly, vaccination intensity may be associated with marginal increases in case rates. This may be an early signal for antibody-dependent enhancement of disease (ADE) or the impact of immune system disturbances (including autoimmunity) in vaccinated individuals. No one is served trying to push such issues under the carpet; independent research and open scientific discourse is the solution, not the problem
- The virus poses an incredibly low risk to younger healthy people, but there is a concerning increase in excess mortality for age groups between 15 and 75) noted in the 2021 EuroMOMO datasets. This requires investigation as to its potential causes
- There appears to be no current scientific basis on which to apply - to any age or population group - coercion as a means of increasing vaccine coverage
- There is no apparent justification for continuing to maintain ‘pandemic’ status. Health authorities continue to use case rates based on molecular testing, not deaths, hospitalisations or press on acute medical services to justify the pandemic. They also ignore the fact that most cases are best treated early, at home (see guidance at the World Council for Health website). Pandemic status continues to give governments unjustified reason to apply escalating and often authoritarian controls over their citizens.
Subversion of the practice of medicine
In many countries now, the state has replaced the doctor as the prime authority in matters concerning health in relation to the risks of this new infectious disease. States have removed the capacity of shared decision-making between doctors and their patients, as well as medical informed consent by the individual, both of which are fundamental to good medical practice.
This is fascinating.
— Robert W Malone, MD (@RWMaloneMD) October 7, 2021
I am apparently no longer allowed to read the New England Journal of Medicine.
They have blocked my internet protocol address. pic.twitter.com/lWWEPhxXLN
A tweet this morning by Dr Robert Malone, the co-inventor of mRNA vaccine technology. He has been outspoken over the scientific basis for global mass vaccination, especially involving younger healthy individuals, and has been the victim of extreme censorship and marginalisation.
The vast majority of doctors are paralysed by the authoritarian system in which they now find themselves. They risk their livelihoods and careers if they speak out. Perversely, they are forced to sideline the four pillars of medical ethics that are central to good medical practice, namely:
- Autonomy – respect for the patient’s right to self-determination
- Beneficence – the duty to ‘do good’
- Non-Maleficence – the duty to ‘not do bad’
- Justice – to treat all people equally and equitably.
That’s why we’re working so hard with our doctor, scientist and lawyer colleagues in the new umbrella with which we’re closely affiliated, the World Council for Health. Central to our shared mission is to provide honest and reliable information to the public, because this can no longer be sought from most doctors who became victims of the coercive regime of top-down, institutionalised, authoritarian public health that’s emerged as a result of this ‘pandemic’. The vast majority of health authorities, and virtually all mainstream media and social media channels are complicit, so also cannot be trusted.
The newly launched World Council for Health website – www.councilforhealth.org.
Enough is enough. Solidarity is emerging to bring together people from divergent backgrounds to help solve the crisis that has been engulfing us. One expression of this solidarity is the #enoughmovement, of which we’re also active members.
Given the widespread suppression of balanced information and scientific analysis, please can we ask you to share this article widely. Thank you.
Next week, we’ll be publishing here on our website Part 2 of this Feature. We'll be looking closely at individual susceptibility to SARS-CoV-2, what you can do to provide protection given the threat of third or fourth waves, potentially exacerbated by vaccine breakthrough and selection pressure from global mass vaccination. We will also be evaluating available data and information on adverse reactions attributed to covid-19 injections.
Visit covidzone.org to find our curated covid content
Get access to unique content, Q&A sessions, discounts, and more - as well as helping to support our work by becoming an ANH-Intl Pathfinder member - for no more than a price of one coffee or herbal tea a month!
Return to Homepage


Comments
your voice counts
07 October 2021 at 8:45 pm
Thank you for a great summary. My understanding is that a person is not counted as fully vaccinated until 14 days after their second injection - this should somehow be taken into account when comparing hospitalisations and deaths between those not injected and those who are.
26 September 2022 at 12:53 am
Thanks Joanna, yes the fourteen days rule has been applied, and yet the deadliest reaction to the shots is very likely to occur in the fourteen days.
I'd like to share my own story on this, with my own data, if I may. The data was made available to me from the research doctor in a study I was in. The data came to my attention after the report from a pathology lab in the USA. My case is an interesting Cov SARS study. It's unique, because of the solid lab testing to back up what I am saying, taken from an exhaustive pharmaceutical study in its own right (including the use of the election microscope). The virus I had in July 20019 looks and behaves in very similar ways to COVID 19, or to be frank, it really is identical, spikes and all, it is a SARS virus. How it plays out after infection depends on the individual person's immune system and other factors like viral load.
So it was 2019 in July, I test positive for Coronavirus 229E, a virus found on bats. "Human CoVs (hCoVs)-229E, -NL63, -OC43, and -HKU1 are endemic worldwide and cause mainly respiratory infections in children and adults." As a child I got the flu every winter and occasionally it deteriorated into bacterial pneumonia with acute breathing difficulty. I read how Coronavirus 229E can get very nasty in humans when the immune system is compromised. I had the flu shot the previous year (2018), and despite that, I still got the Coronavirus 229E, which that year was the seasonal flu, and I was very sick with a strange new feeling about it. That year you could hear the same nasty dry cough, everywhere.
Recent medical research (links below) with US military personnel shows that flu shots can open the pathway to SARS-like infections, the opposite of what we might expect when your doctor says your resistance will improve. I quote from the paper on the military personnel study: "Receiving influenza vaccination may increase the risk of other respiratory viruses, a phenomenon known as virus interference." How I came to have a virus lab test analysis in 2019 was because I was a subject in medical research to test a tablet that was thought to protect the taker from respiratory infection. It didn't work and the research was abandoned. A test on my nasal sample, when I was still quite sick, was conducted, and the sample couriered to the US.
My point here is multifaceted: the test was available only in the US for this research project - based in the US and very accurate (electron microscope), not your false positive PCR test. My test was no doubt expensive (in the US). I felt the infection I had could have gone very badly, with hospitalization, even death, as it felt unusually dangerous. Had my immune system been compromised, as a 68 year old, ehr young, reasonably fit, I could have succumbed and because of my medical history, I was very worried once COvid 19 turned up. My point again: the Coronavirus 229E infection was from a virus closely related to Cov SARS 2 originating from bats in Ghana, which can cause SARS and can be severe, yet I overcame the infection with the sun, vitamin C, etc.
I believe this is the case for this latest 'Pandemic'. CoV SARS 19 virus and coronavirus 229E are almost identical. Theoretically, and data has shown this, we can overcome, have no fear, except for social disorder and bankruptcy for so many after the Lockdown, with more to come on food supplies and jobs. There are papers below that discuss the particular cousin of the Covid-19 causing virus, my one, 229E. A search on Google Scholar reveals many papers on the Coronavirus 229E and also many papers on the prevalence of COV SARS 2 earlier than the Wuhan outbreak in 2919.
https://www.ncbi.nlm.nih.gov/pmc/articles/PMC2819850/
https://www.sciencedirect.com/science/article/pii/S0264410X19313647
https://academic.oup.com/cid/article/54/12/1778/455098
https://academic.oup.com/jid/article/215/7/1102/3084413
Italy: https://pubmed.ncbi.nlm.nih.gov/33176598/ https://wwwnc.cdc.gov/eid/article/27/2/20-4632_article… https://pubmed.ncbi.nlm.nih.gov/32835962/
Spain: https://medrxiv.org/content/10.1101/2020.06.13.20129627v1…
Brazil: https://medrxiv.org/content/10.1101/2020.06.26.20140731v1…
USA: https://academic.oup.com/cid/advance-article/doi/10.1093/cid/ciaa1785/6012472…
France: Evidence of early circulation of SARS-CoV-2 in France: findings from the population-based “CONSTA...
Using serum samples routinely collected in 9144 adults from a French general population-based cohort, we identified 353 participants.
07 October 2021 at 10:29 pm
Another great article, Rob. There's a small typo you might want to fix - "Don't think it's only 'the other wide' who're doing it." ...I presume that should read "other side".
08 October 2021 at 8:54 am
Thanks for your sharp eyes Forrest and letting us know about the typo. This has been fixed now.
Warm wishes
Melissa
09 October 2021 at 10:24 pm
As always a thorough analysis.
Just wondering though...the analysis follows the germ theory of disease, thus it does not take into account both sides of the equation of health and disease. 1) Germ theory aka modern medicine (L Pasteur - germs cause disease = vaccinate or kill off is some way) vs Terrain theory/internal environment (A. Beauchamp/C. Bernard = treat the person not the infection/clean the internal terrain).
Naturally terrain theory is more difficult as it means one has to take a lot more responsibility for one's health (myself included).
I am also wondering if Geert VB and R Malone are perhaps controlled opposition as they are also fear mongering in certain ways and given their backgrounds also support the germ theory of disease!
Love to hear your thoughts?
Your voice counts
We welcome your comments and are very interested in your point of view, but we ask that you keep them relevant to the article, that they be civil and without commercial links. All comments are moderated prior to being published. We reserve the right to edit or not publish comments that we consider abusive or offensive.
There is extra content here from a third party provider. You will be unable to see this content unless you agree to allow Content Cookies. Cookie Preferences