

Content Sections
In this week’s Coronacast, our founder Rob Verkerk PhD, explains why we think the UK and other governments who are using the ‘R number’ – the reproductive rate of SARS-CoV-2 – as a key measure to decide when and how to ease lockdowns are on the wrong track.
Worse than that; how relying on the R number will reduce herd immunity and may put more people at risk directly and indirectly.
For those, who’d prefer to read a transcript, you’ll find this below the video.
Please share our content widely as this is the main mechanism available to us to extend reach given the censorship and restrictions imposed by social media platforms. Thank you.
Note: You will see an advertising banner beneath our videos that play off the Brighteon platform (when they are not maximised). This advertising helps support the Brighteon platform that doesn't charge subscribers for their content, is committed to free speech, yet is also respectful of copyright-related law. We'd like to clarify that no advertising revenue from Brighteon is received by the Alliance for Natural Health Intl.
Video Transcript
Over the last couple of weeks, we’ve seen governments and news outlets become more and more obsessive about the “R-number.” In this video we explain why we believe R numbers are not the right metric to base lockdown policies and decisions on – and why you shouldn’t let them frighten you.
What is the R number?
The ‘R’ in the term ‘R number’ stands for ‘reproductive’. The R zero is used in epidemiology as an estimate of the ‘basic reproductive rate’ of infectious diseases. That’s simply the number of people expected to be infected by one person in a population that’s entirely susceptible – one that’s never been exposed to the pathogen in question before.
For SARS-CoV-2 most estimates of the R0 range between 2.2 and 3. By comparison with other infectious diseases that means Covid-19 is moderately infectious or contagious, not highly contagious as we’re often told. That puts it smack in the same ballpark, in terms of contagiousness, as the common cold – also caused by a coronavirus, as well as Hepatitis A. It also makes it around 4 to 6 times less contagious than measles or mumps.
-
Find related articles, information and videos in our Covid Zone
By comparison, the Spanish flu pandemic in 1918 killed a staggering 50 million when the global population was estimated to be just 1.8 billion – in other words 2.7% of the world’s population at the time. It killed so much more indiscriminately, also taking out young and healthy people. Yet it had a lower R0 value than Covid-19 – around 1.8 as against one that exceeds 2 for Covid in a susceptible population.
In reality, the transmissibility means very little on its own when you don’t also consider the risk of infection – the deadliness or mortality rate caused by the disease.
So while the R number gives you a measure of the transmission potential – the infectivity or degree of contagion of a pathogen, there are many other factors that affect it in the real world – in a pandemic like the one we’re dealing with now.
These include:
- latency – the time period between catching the infection and it manifesting as disease;
- our behaviour;
- government policies on lockdown;
- the length of time viral shedding occurs in those infected;
- exposure of viral particles to ultraviolet light and sunlight when in droplets aerosols or surfaces;
- the weather and environmental conditions generally, and;
- the proportion of a population that might already have immunity.
Why is the R number viewed as being so important?
So while the R number is a very important way of understanding the transmission potential of a disease organism in the early part of an epidemic or pandemic, as more people are exposed to the disease and more people become immune, epidemiologists need to look not at the basic reproductive rate but at the effective reproductive rate. That’s shortened to the Re or Rt. This takes into account all of the factors we listed above – and if the Rt can be held below 1, the disease will dwindle and eventually peter out. Over 1 it goes the other way. But again – we shouldn’t just accept the notion of eradicating a disease at all costs – without carefully weighing up the societal cost of trying to do this – as well as what the alternatives might be.
Why is the R number not relevant to lockdown?
High R numbers in themselves are obviously no reason to lock down societies. That’s why we don’t do it for measles or mumps. It’s the consequences of infection – particularly the risk of death – combined with its transmissibility – that determine the overall risk to the population.
The trouble here is that we actually don’t have any high quality evidence or data that tell us the true deadliness of this coronavirus. Every day we hear broadcasts of the fatality rates associated with Covid, but these data aren’t realistic measures of the deadliness of the virus. That’s because the normal work of pathologists has been sidelined because of the perceived risk of infection.
But it’s worse than that. Before the Covid pandemic, when someone who was fatally ill with say cancer or heart disease went on to die because in their terminal state they weren’t able to cope with a respiratory infection such as flu or pneumonia, the cause of death was generally given as the primary underlying disease – the cancer or heart disease. That’s because flu or respiratory diseases aren’t regarded as notifiable diseases and it’s recognised that it was the underlying disease that made the person so vulnerable in the face of the infection.
But with the arrival of Covid, the list of notifiable diseases has been amended to include Covid-19. This change in the way causes of death are recorded without any opportunity for any proper investigation by pathologists has a huge impact on people’s and government’s sense of the deadliness of the disease – and it’s actually a serious misrepresentation of reality.
On top of that, it’s even more difficult to do country to country comparisons as different countries record deaths in different ways. Sometimes deaths are only recorded as Covid deaths if the death is associated with a lab confirmed case – other times if there’s been no testing – just having a report of some of the key symptoms makes it count as a Covid death. In the UK, for example, as of 1 June, deaths linked to Covid that are confirmed by commercial labs, not just government labs, have just been added to the Covid death toll.
Let’s have a look here at the death counts in a range of different European countries, as collated by the European Centre for Disease Prevention and Control – the ECDC.
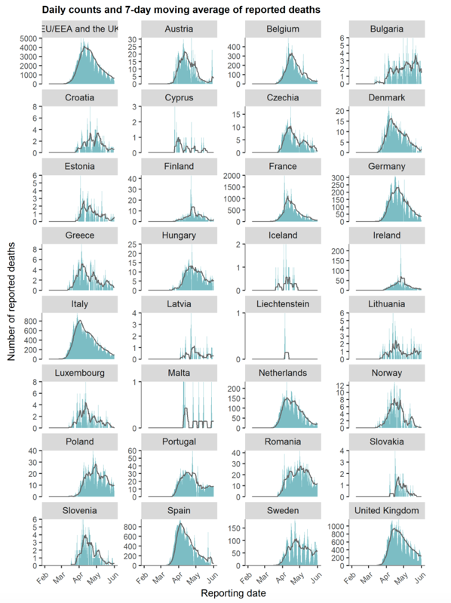
Source: European Centre for Disease Prevention & Control (ECDC) - Covid-19 surveillance report Week 21, 2020
In green you’ll see the daily counts – and then the smoother black lines show the weekly moving average of reported deaths across the different countries.
You’ll see that in most countries with significant numbers of cases – which is shown in the vertical axis – there’s a clear, typical three month cycle for the epidemic wave, and that’s regardless of the degree of the lockdown measures. You’ll see a little upward blip in Sweden that’s generating a lot of media hype at the moment – but remember that’s coming from relatively small numbers when compared with the UK.
What other metrics could we use?
So we’ve got to accept that there are just no reliable data on how many deaths are caused directly by Covid.
So how else can we look at the deadliness part of the equation? What many of us are agreed on is that data on ‘excess mortality’ are one of the fairest ways of looking at the true risk of death caused both directly and indirectly since the virus came on the scene at the start of the year. Excess mortality tells us the number of additional deaths in a given time period compared against the number that would be expected to die in previous years. Therefore it doesn’t depend on how Covid-19 deaths are reported – or even whether or not they’re misreported. It depends simply on knowing how many people have died, and of course that’s something there can be very little argument about.
Excess mortality data from EuroMOMO that collates official figures from 24 European countries shows that even in the worst hit part of the world – Europe – some countries – namely Denmark, Estonia, Finland, Germany, Greece, Hungary, Luxembourg and Norway have experienced no excess mortality at all.
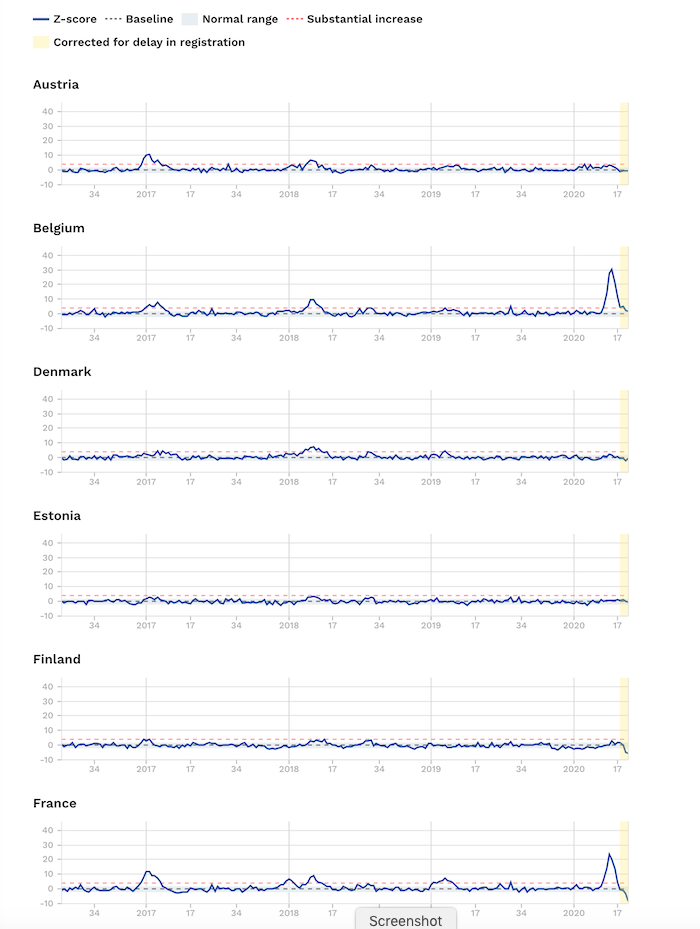
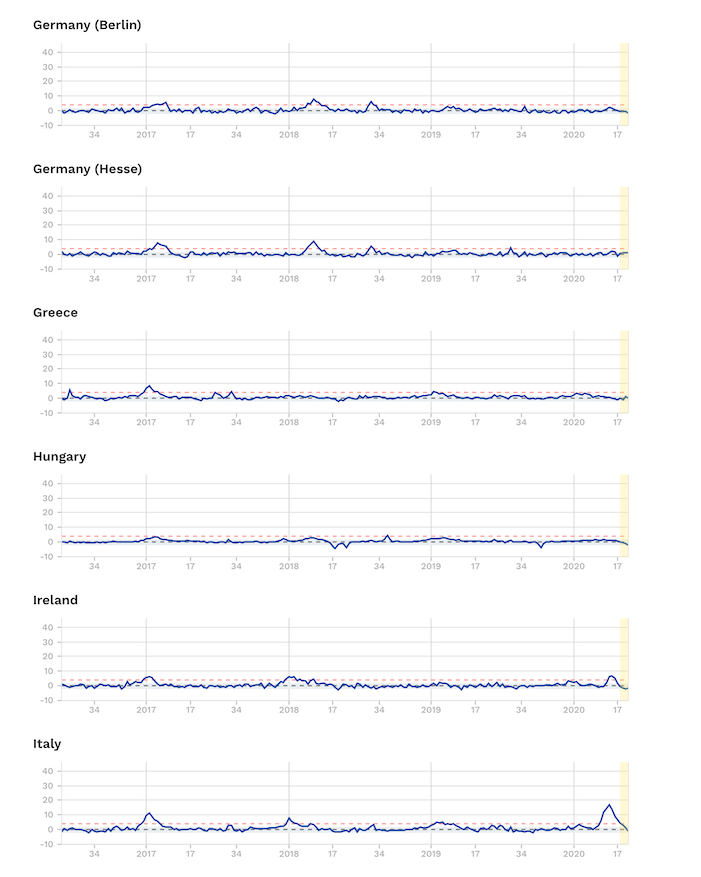
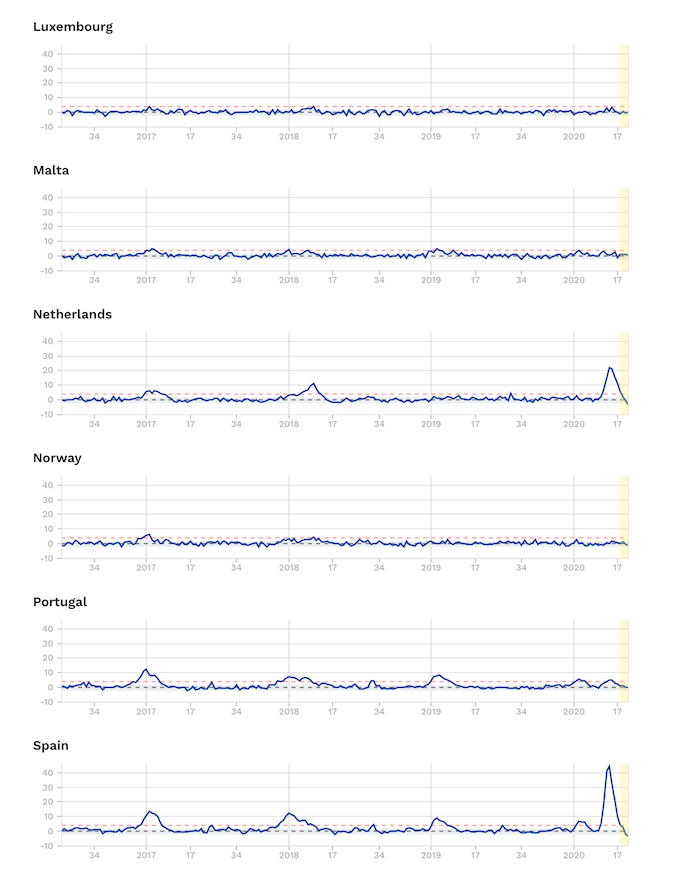
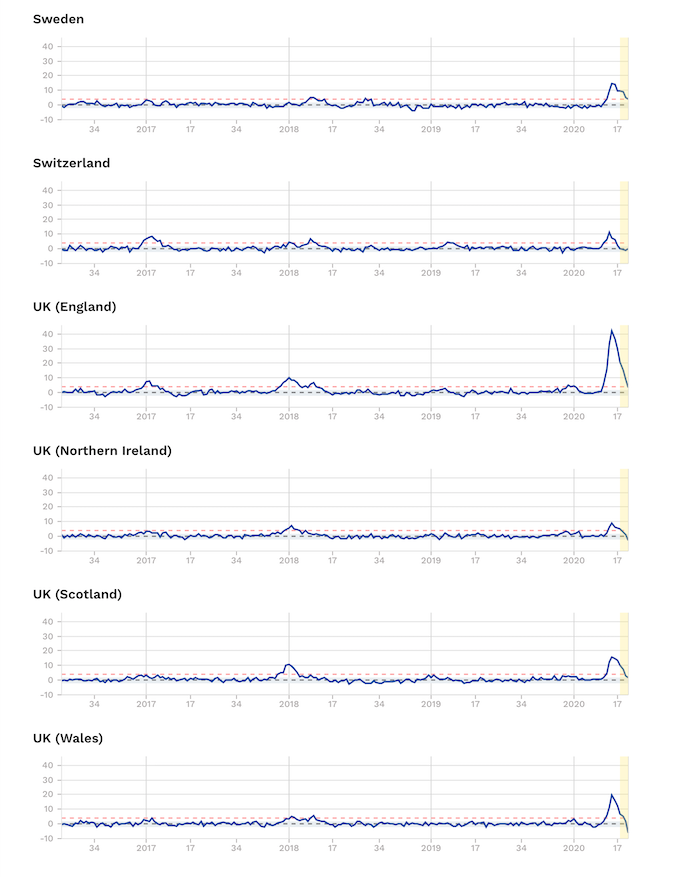
Source: EuroMOMO. Note Z-scores are a statistical measure that allows the comparison of mortality patterns between different populations over time. The unit of measurement is the standard deviation. Find out more.
Others, like Ireland, Portugal, Sweden – without its full lockdown – and also Switzerland, Northern, Ireland and Scotland, have only experienced small increases.
England and Spain – with high, but nevertheless short-lived peaks in excess mortality, are actually the only two real outliers. And it’s still unclear what all the contributory causes might have been. But we know, for example, that London and New York’s tragic death tolls were made worse by these being the two cities with the two busiest airports in the world. That would have undoubtedly contributed to more index cases at the early part of the epidemic for which a grave price was paid later.
-
Our work is only possible with your continued support and kind donations.
But the lack of adequate shielding of older, vulnerable people especially in care homes was undoubtedly another key factor, as was the underlying vulnerability of infected populations.
What next?
It’s still not clear how much these trajectories are related to the extent of lockdowns or just the natural history of the disease. The patterns would suggest that lockdowns are not as important as health authorities and governments would have us believe.
There is also no doubt that a really important way of reducing the Rt number – the effective reproductive rate – is by increasing the immunity of the population. Yes – that’s herd immunity – something that was talked about a lot at the start of the pandemic – but less so now, as universities, governments and vaccine makers scrabble to create Covid vaccines. The reality is there is no vaccine today and there’s also no guarantee that there will be one that both works and is safe. So what are we waiting for?
You might then ask: How can we increase herd immunity safely? Frankly – the way it’s happened over and over again throughout our evolution. That means being exposed to the virus, not hiding from it. But because research over the last few months has shown clearly who is likely to be most at risk, the key is to ensure that those who are exposed are the most resilient. That particularly means the young and healthy – and it’s the reason we’ve been arguing for a reopening of schools. But it also means that the most vulnerable need to be shielded, especially if the virulence of the virus increases later in the year.
While this is widely recognised, if we obsess over the trajectory of the R number what we’ll do is actually reduce the number of healthy people who are infected meaning that we’ll likely increase, not reduce, the risks of a second wave of infection later in the year.
History tells us that epidemics caused by respiratory viruses come in waves – and the key factors that cause the waves to wax and wane are factors like exposure to people, environmental factors like warmer weather and changes of seasons, and of course the changing and more often than not declining virulence of the pathogen itself.
So – contrary what we’re hearing from governments at the moment – if the R number goes up in a relatively resilient, non-susceptible population, it’s actually a good thing not a bad thing.
That means, in the real world, if we’ve effectively shielded the vulnerable sectors of the population, why are we being asked to keep such a close eye on any increases in the R number and then being told to expect a tightening of lockdowns? Locking us down again because healthy people have become infected makes no sense – it’s part of the solution not part of the problem.
Research over the last few months has shown very clearly the pattern of comorbidities in adults, especially older adults, that makes some people susceptible to severe disease. That includes being overweight, having metabolic diseases like type 2 diabetes, hypertension, cancer, or a history of lung or kidney disease.
So let’s quit obsessing about R numbers as the primary way of deciding by how much lockdowns can be eased or should be tightened. Instead, we’ve got to look at the big picture of what’s really going on.
That means carefully weighing up the wider consequences – not just in terms of the direct effects of the disease but also the indirect health, social and economic consequences of the measures we’re being forced or asked to take by our governments.
In many countries, we’re in grave danger of moving ever closer to a police state, one in which populations are controlled by government authorities who justify their actions supposedly on the basis of science. Well – R numbers in isolation – don’t tell us anything about the risk of the disease so it’s utter nonsense – and therefore bad science – to let this number on its own determine whether healthy people can gather in larger groups – or for that matter – go to the beach.
If we’re to help co-create a more sustainable future in which we retain the rights and privileges that many before us have fought so hard to gain, without widening further the social, economic and even political inequalities that have plagued so many societies, we need to see a big change in the criteria being used to determine the extent by which governments control and limit the freedoms of their populations.
You can find out below how to get this video to your elected representative.
UK: Find your MP
Germany: Deutscher Bundestag
France: Rechercher votre député
Sweden: Ledamöter & partier
Ireland: Dáil Éireann and Seanad Éireann
United States: Find Your Representatives
Canada: Current Members of Parliament
Australia: Contacting Senators and Members
If this article was useful to you please consider sharing it with your networks
>>> Find out more at covidzone.org
>>> Visit our YouTube channel
>>> Back to Alliance for Natural Health International homepage


Comments
your voice counts
04 June 2020 at 9:31 am
Have you dicounted latest reports that the coronavirus may be a blood vessel disease?
04 June 2020 at 7:43 pm
Hi Nicky, no, certainly not discounted at all. We're very well aware that SARS-CoV-2 can quickly become a blood disease as the virus causes iron to be released from the haemoglobin in red blood cells. Then is can go onto damage the delicate endothelium in the blood vessels creating coagulation once it's broken through the epithelium of the alveoli in the lungs, but this tends only to happen in the most severe responses to the infection. This is why the MATH+ protocol that we reported on a couple of weeks back: https://www.anhinternational.org/news/why-is-success-in-critical-care-being-ignored, includes intravenous vitamin C, anticoagulants and steroids to calm the inflammation and kill the virus and has been used so successfully.
Best wishes
Meleni
04 June 2020 at 10:05 am
Hi Rob, just an important correction: the world population in 1918 was c.1.8 billion. The 500 million figure was the number infected.
04 June 2020 at 3:10 pm
Hi Jim, thanks so much for alerting us to the error. We've now corrected this.
Warm regards
Melissa
04 June 2020 at 10:36 am
Rob & team,
I sit here talking to the Laptop screen, telling you to stop being so practical and using you common-sense (intelligence, training, knowledge, experiences and instincts).
When are you going to "stand" for PM of the UK, anyway your hair-do is attractive compared to that BJ's permanent look as though he is under the shower, and you have maturity too, something that Boris is never likely to experience, even with a second run at a family.
Your discourse in your opening letter:: NO, your NOT depressed, this is exactly what is happening, and is and shall get worse around the World, as this Flu is a mere Sign & Symptom of very deep dissatisfaction that has and been building up re Governments & other areas of society, for many years now, and by ALL areas of Society in so many Countries.
Mediocrity in the Government who are THE representatives OF THE PEOPLE is normal now - sadly! and handing out money is their solution as they all ape each other in this
Globalisation, (except Japan), and Science needs to step up with their fallible measures and have the courage to band together and speak out, Science is part of but NOT the answer, though people who are not Scientists are promoting Science as the top billionaires in this Flu period have made 75 BILLION in that space of time. Insider trading?
Its like-minded people informing others (& we have seen a few courageous Scientists speaking in the public domain, but far more are needed, and coherent groups of all persuasions are needed as billionaires have their well-funded Public relation machines on full alert - Yes, the word transparency is most applicable to Science too.
04 June 2020 at 4:29 pm
I once again refer interested readers to the interviews with Dr. Zach Bush, undoubtedly the most brilliant medical scientist and doctor on the planet (also known as the "Einstein" of medicine), who has clearly established the origin and effects of the coronavirus. According to Zach Bush the coronavirus is a reaction to the pressure we have placed on the environment in terms of chemicals, toxins, plastics, unnatural production methods etc. As a result, the virus, which is not particularly dangerous per se, binds with air pollution, especially a carbon particulate called PM 2.5, which is extremely dangerous to human health and, apparently, a form of cyanide also seems to be involved. The latter explains why virus victims turn blue and are unable to cope with the delivery of oxygen. In such a situation patients on ACE inhibitors and/or statins are virtually doomed. This means that all people with virus symptoms should be immediately taken off the aforementioned medication and their treatment should involve cyannide detoxification for which established methods exist. The conclusions, therefore, are obvious: many people have died unnecessarily because of their incorrect treatment and most of the deaths have occurred in areas with high air pollution. Lockdown and social distancing have had no positive effect and in any case billions of viruses are in the air at any one time and at any place. The coronavirus, for example, has been found in the Antarctic as well as deserts. The accuracy of Dr. Bush's analysis is vindicated on a daily basis.
05 June 2020 at 10:51 am
I sent the video regarding the Government's over-reliance on the R number to my MP, Sir Paul Beresford. This was the reply I received from his senior Parliamentary researcher, Sam White.
"I have drawn your email of the 4th June to Sir Paul’s attention. He has asked me to state that he prefers to draw scientific advice from field leading epidemiologists and experts in pandemic control – that is to say – the experts who are advising the Government. He trusts that these scientists can offer a more reliable assessment than an organisation (the Alliance for Natural Health) which promotes pseudo-scientific alternative medicines."
Unfortunately, with this type of bias and closed mindedness I see little hope of getting my MP to do anything other than issue insults! Not a good day for democracy!
06 June 2020 at 11:30 am
Hi how did you send it over? I went on the link but unable to understand how to get the video sent?
This is the problem, i think that they're going to have away with any natural treatments and practitioners so they will not listen, they've all been bought. We need help.
06 June 2020 at 12:30 pm
Hi Lara, are you trying to send the video to your elected representative? If so this is the link to the video that you can include in an email or letter that you send to your representative - https://youtu.be/oxjc2-osYPE. You can also send the link to this article-https://www.anhinternational.org/news/the-r-number-what-we-re-not-being-told/.
I hope this helps
Warm regards
Melissa
18 June 2020 at 8:17 pm
I like Rob Verkerk so much! And that goes for Meleni and Melissa too. You are quality.
18 June 2020 at 10:01 pm
You're too kind Per. Thank you so much for your lovely wishes. Rob and Meleni will be very pleased when I pass your message on.
Best wishes
Melissa
Your voice counts
We welcome your comments and are very interested in your point of view, but we ask that you keep them relevant to the article, that they be civil and without commercial links. All comments are moderated prior to being published. We reserve the right to edit or not publish comments that we consider abusive or offensive.
There is extra content here from a third party provider. You will be unable to see this content unless you agree to allow Content Cookies. Cookie Preferences