
Content Sections
By Rob Verkerk PhD, founder, executive & scientific director
Transitioning from being disease-centric to case-centric
You’d have to have been avoiding the airwaves if you hadn’t heard you should be preparing for a rise in community infection of SARS-CoV-2. Governments are preparing us for more lockdowns and other restrictions on our freedoms in an effort to reduce transmission. Infections in some parts of some countries, including the UK, do indeed appear to be increasing, but how much has this got to do with the amount of testing going on? It’s something of a no brainer: test more, and you’ll find more cases.
What if the infections are not causing significant, or any, disease in the majority of those infected? Do we really need to impose restrictions that shut down economies again - wrecking livelihoods, businesses and our ability to function as the social animals we are?
Have you also noticed the mainstream media has largely stopped reporting on COVID deaths on the evening news? The whole mainstream narrative is moving away from publicising the serious effects of infection – in other words serious or critical COVID-19 disease – to talking about the changes, especially the rise, in the number of cases. The pandemic appears to have morphed into a casedemic and few are talking about it
The cases being reported aren't cases of disease, where symptoms have been reported. These are cases of infection as measured by PCR tests, which in turn have uncertain levels of accuracy. Remember this: SARS-CoV-2 infection, including when it is erroneously reported from a false positive in a PCR test, does not equal COVID-19 disease. However, the mainstream media and even governments seem very happy to conflate the two.
In trying to justify the accuracy of antigen tests, government authorities and medical device companies selling tests often refer to figures citing the sensitivity or specificity of tests that are often 90% or higher. However, studies evaluating the specificity of tests show marked differences between studies and between the source of specimens, with throat swabs in one study showing only 32% specificity for throat swabs against 63% of nasal swabs.
Real-world test results for false positives (where an uninfected person is erroneously given a positive result) and false negatives (where an infected person is erroneously given a negative result) are also all over the place. Various studies have found such errors for either false positives or negatives to be highly variable, sometimes exceeding 50% .
Look ⊙▂⊙ at the data
To get a handle on what’s going on, we’ve pulled figures together (using Worldometer as our source data) from 8 countries: England and Wales (combined), the USA, Brazil, Sweden, Finland and Italy. We looked at numbers of cases of infection, the number of tests performed and mortality rates (Figs 1A-1G below). Remember that mortality, if caused primarily by SARS-CoV-2 infection, would typically be delayed by about one month from detection of infection by PCR testing. PCR tests for those who go on to suffer severe disease is most likely to occur when symptoms of COVID-19 are expressed. These 8 countries administered various degrees of restrictions, Sweden having the lightest restrictions, having not closed schools and most businesses including restaurants and cafés. The pandemic wave hit Brazil in the southern hemisphere later and President Bolsonaro’s management of restrictions was what could be described as complacent.
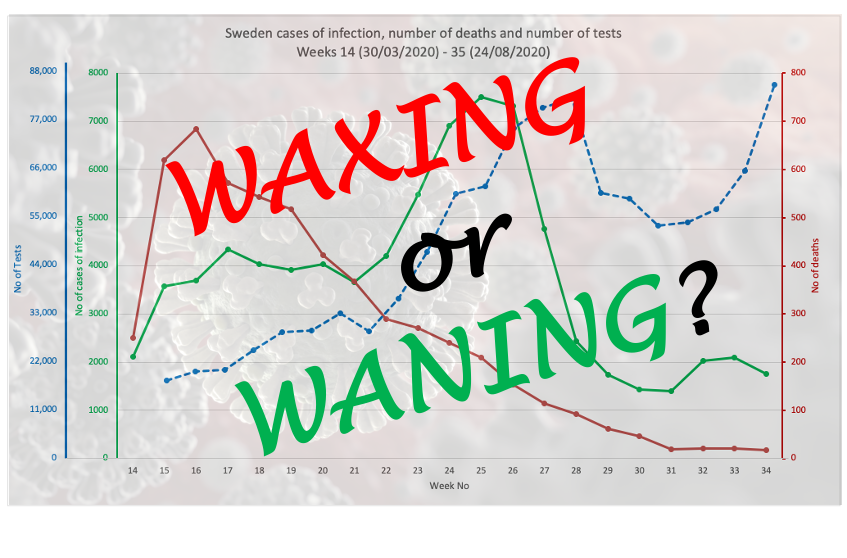
We’ve plotted three variables on each, namely numbers of cases (of infection), numbers of deaths and numbers of tests (Figs 1A-1G). You can see in all cases except Sweden (Fig 1C) and Finland (Fig 1D), the number of cases is roughly proportional with the amount of testing performed. If it were exactly proportional, it would mean there is a net zero increase in cases (i.e. no increase, but also not a decline).
If the numbers tested and the number found to be infected actually diverge, as appears to be happening over the last 3 weeks in Sweden, it tells you something quite different: that community rates of infection are going down. That’s the best news you can have – and might, if you were an optimistic type, be considered an early signal of the end of the primary pandemic wave. If this is the case, it's very likely a result of higher levels of community infection and subsequent naturally-acquired immunity.
More time is needed to be sure, of course. All very interesting when Sweden was for many weeks in the international ‘naughty corner’ for not playing by the World Health Organization (WHO) rules with a full-blown lockdown and social distancing policies in public places.
Of the figures below, Finland (Fig 1E) is a kind of in-betweener. The numbers were low to begin with (note y-axis scales), but we can see what appears to be the beginning of a levelling out of cases despite increased testing. That’s also good news, but not quite as good as that afforded to light-lockdown Sweden.
Waning pandemic?
News of Spain’s ‘out of control’ infection has hit the news, with the Financial Times (FT) headline today exclaiming “Covid: why Spain is hit worse than the rest of Europe”. But that’s only when you look at the ‘casedemic’ rather than the mortality induced by the pandemic (Fig 1E). While there is a slight upturn, only time will tell if it kicks up markedly. That might depend on what age groups are infected. But clearly the FT is worried, positing: “The big question is why things have gone so wrong”.
The answer, in part, appears in the FT’s own article, issued by María Jesús Montero, a government minister and spokesperson. She noted that roughly half the current cases were asymptomatic and that hospitalisations and deaths were far below their March-April levels. The average age of those infected has dropped from 59 at the peak of the initial infection wave in March, to 38 years now. That’s caused those who prefer to remain fearful of SARS-CoV-2 to rail against young people getting together for summer parties – as young Spaniards and tourists in Spain like to do over July and August. Turns out, this might be just what the doctor (should have) ordered.
These changes in the nature and consequences of infection are all important indicators of what appears to be a significant change in the progression of the pandemic. They suggest we might be witnessing, in some parts, the tail of the main pandemic wave. Will it just peter out like the very closely related SARS(1) and MERS before it? We don't know. Maybe. The infection of course moves, so even in the USA, there has been a delay in the arrival of the first pandemic wave in the southern states making some think it was a second wave. The hallmarks of the pandemic might now be looking more like lower virulence (risk of serious disease and death) and younger people being infected. These might be good signs, not bad ones. Something to be rejoicing about, not fearful about. Maybe.
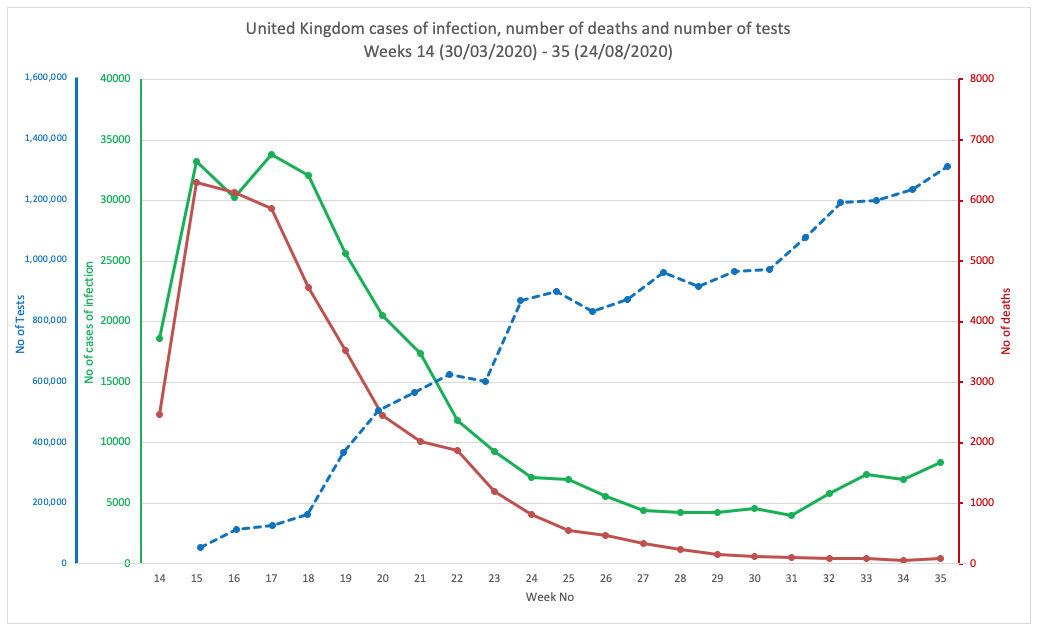
FIG 1A. UNITED KINGDOM
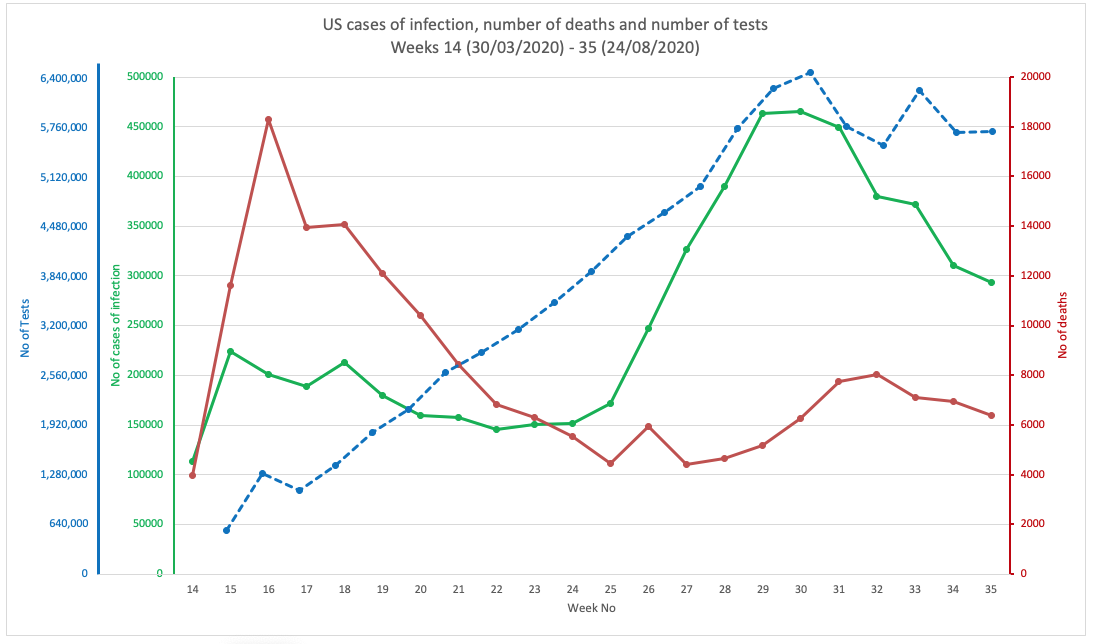
FIG 1B. UNITED STATES OF AMERICA
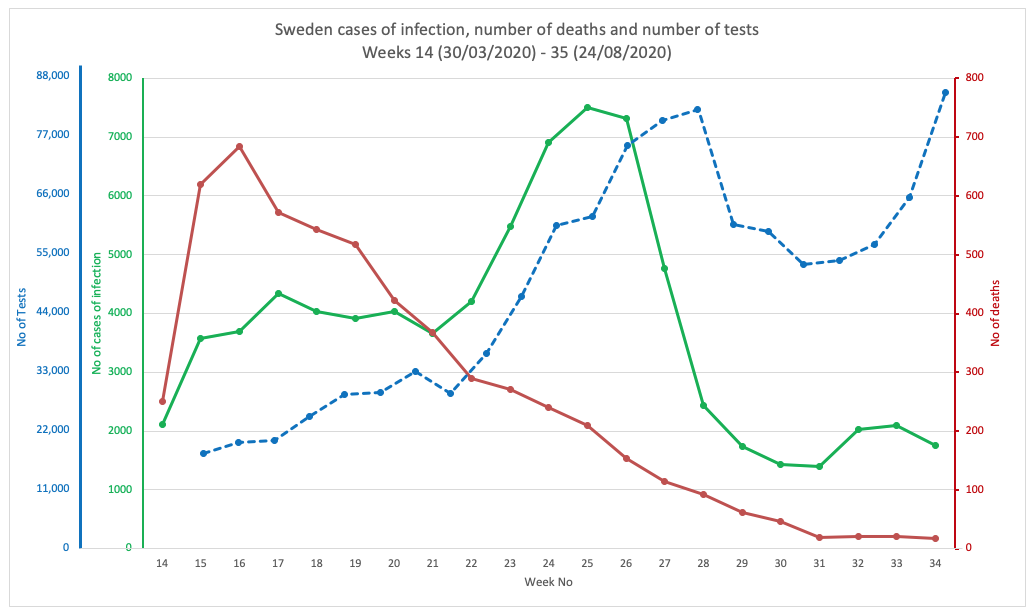
FIG 1C. SWEDEN
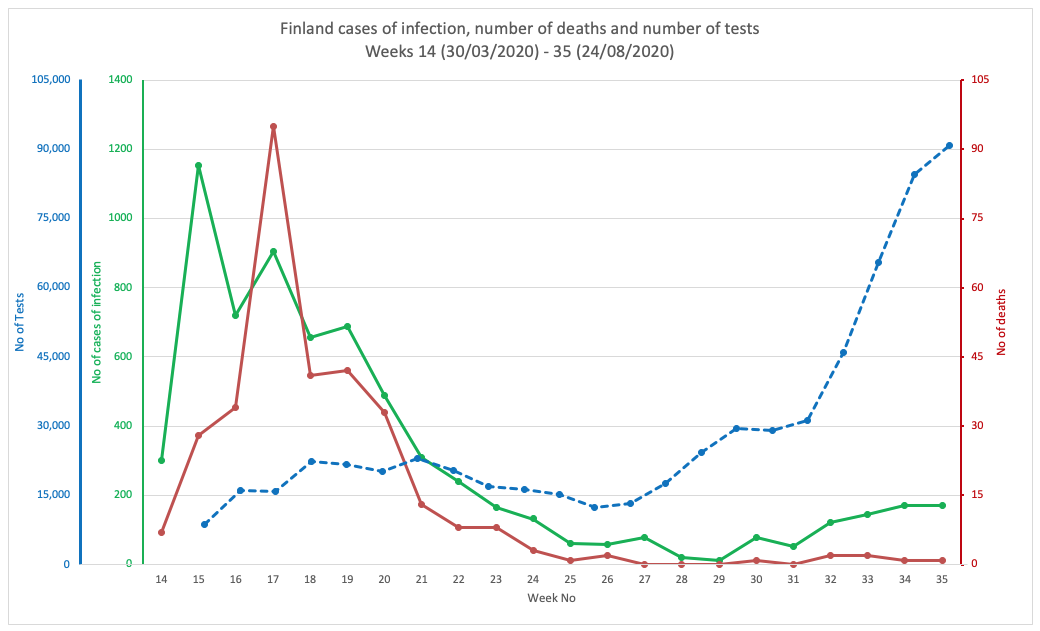
FIG 1D. FINLAND
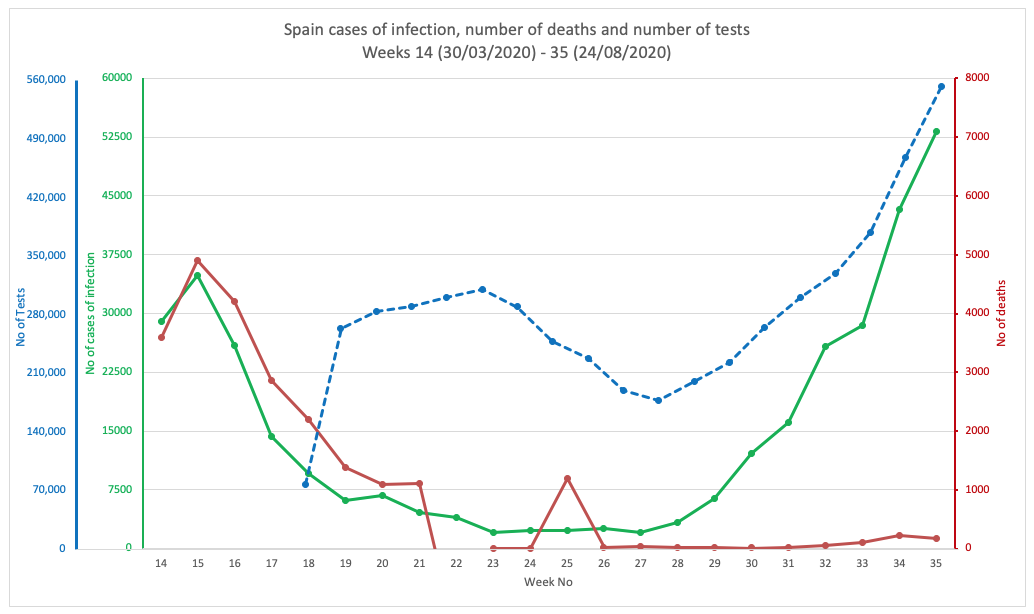
FIG 1E. SPAIN
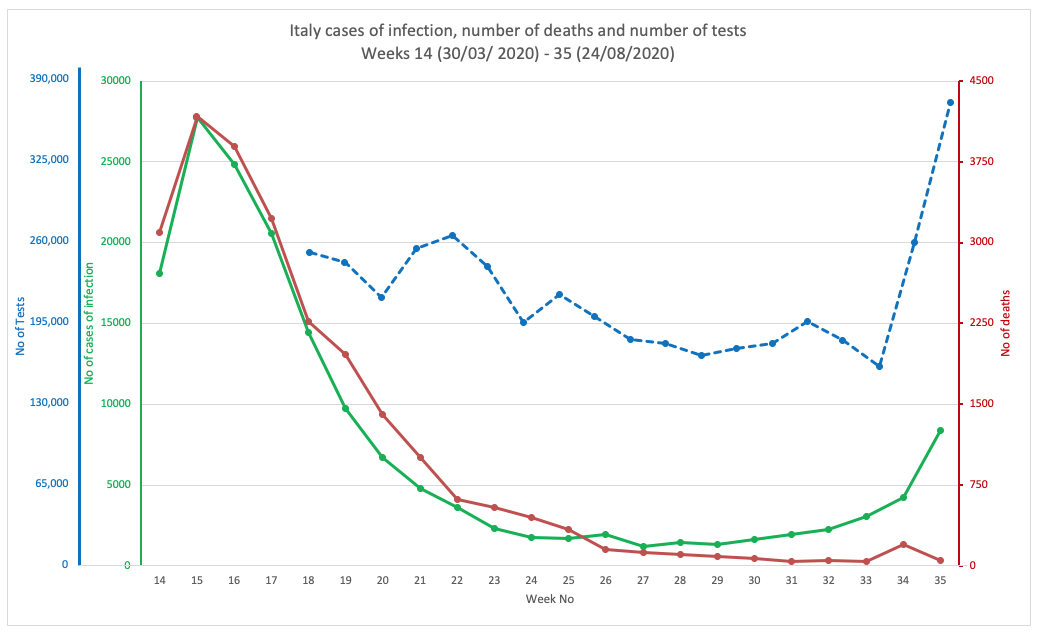
FIG 1F. ITALY
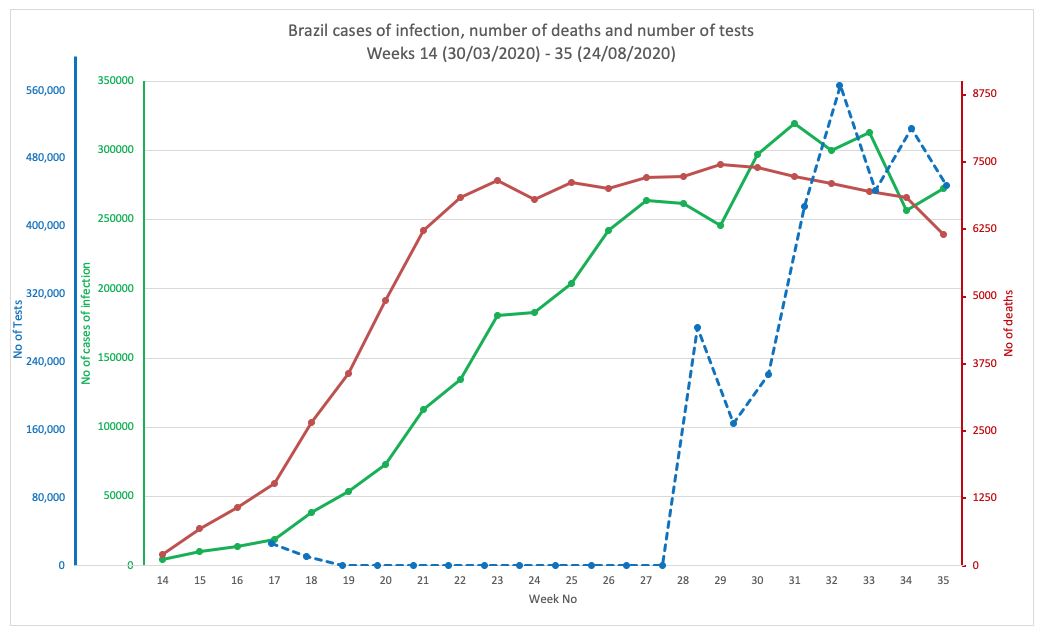
FIG 1G. BRAZIL
FIGURES 1A. TO 1G. (ABOVE). CASES OF INFECTION, MORTALITIES AND NUMBER OF TESTS IN EIGHT COUNTRIES THROUGHOUT THE PANDEMIC PERIOD. SOURCE DATA: WORLDOMETER.
© 2020 Alliance for Natural Health International
Age drift
To look at what might have been happening with respect to ages, we plotted the figures for England and Wales (source data: Public Health England) over the whole pandemic period, looking both at cases of infection (Fig 2A.) and deaths (Fig 2b). You have to take into account that testing was more geared towards those who had the most serious disease in the early part of the infection, so that will confound the trends. It probably explains why there is such a big drop in the number of cases among the 80+ age group from the start of the pandemic to the present time (Fig 1A.) What you'll also note is a particular rise in infections among the young age groups, especially the 20 to 29-year-olds and even school-age 10 to 19-year-olds.
Fortunately, none of this translates to deaths, certainly not in the younger groups that are now the predominant ones with infection in England and Wales, at least. But also not in the elderly groups that were hit so hard in the early surge of the pandemic.
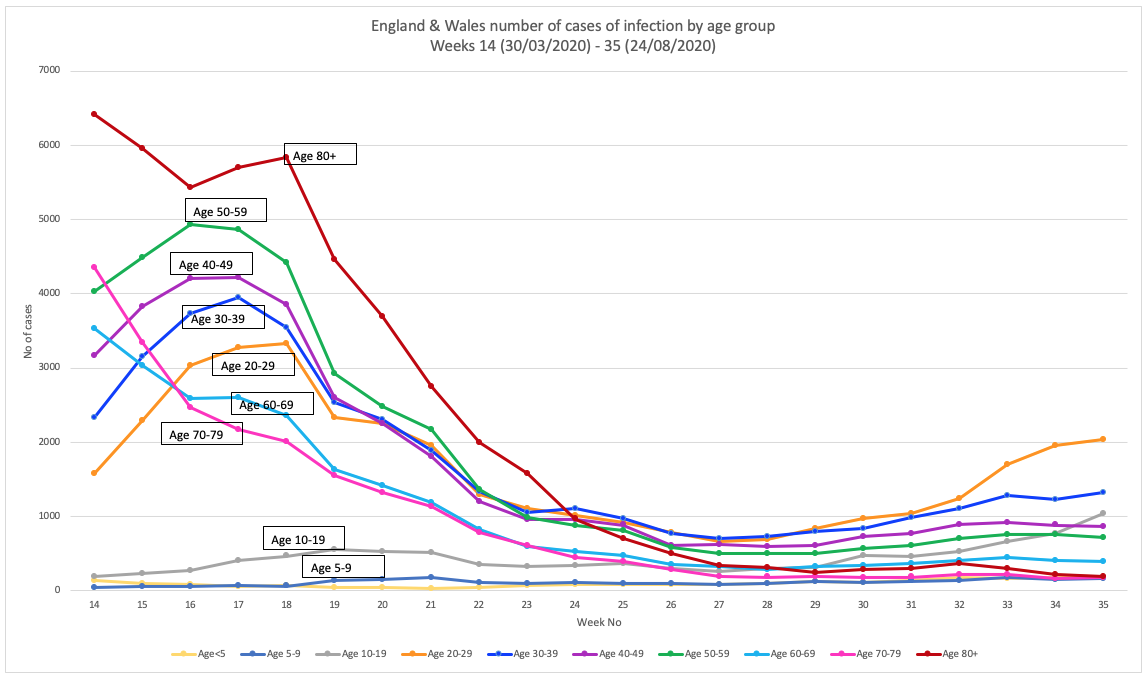
FIG 2A. NUMBER OF CASES OF INFECTION BY AGE GROUP
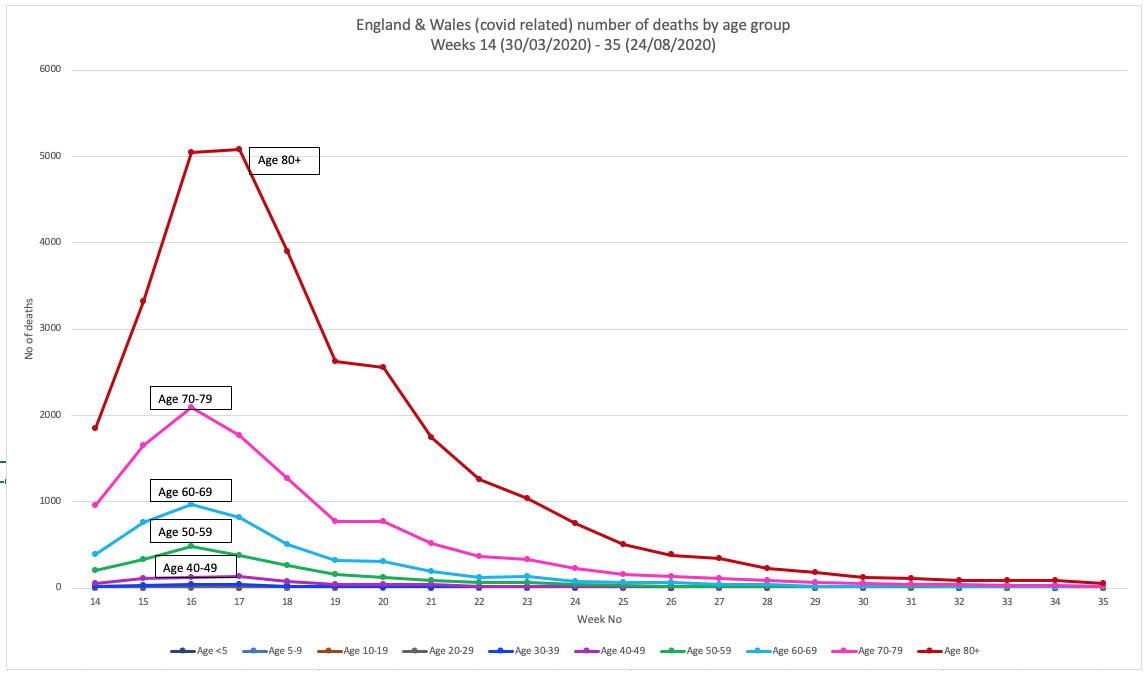
FIG 2B. NUMBER OF DEATHS BY AGE GROUP
FIGURES 2A AND 2B. CASES AND DEATHS IN ENGLAND AND WALES THROUGHOUT THE PANDEMIC PERIOD. SOURCE DATA: PUBLIC HEALTH ENGLAND.
© 2020 Alliance for Natural Health International
This picture of declining death rates can be estimated by the infection fatality ratio (IFR) that takes into account the typical one-month delay between onset of symptoms and death. Our view is supported by recent estimates of the IFR in England determined by Dr Carl Heneghan and his team at Oxford University's Centre for Evidence Based Medicine using data derived both from the Office for National Statistics (ONS) and the Medical Research Council (MRC).
These data are shown in Figures 3A and 3B, respectively.
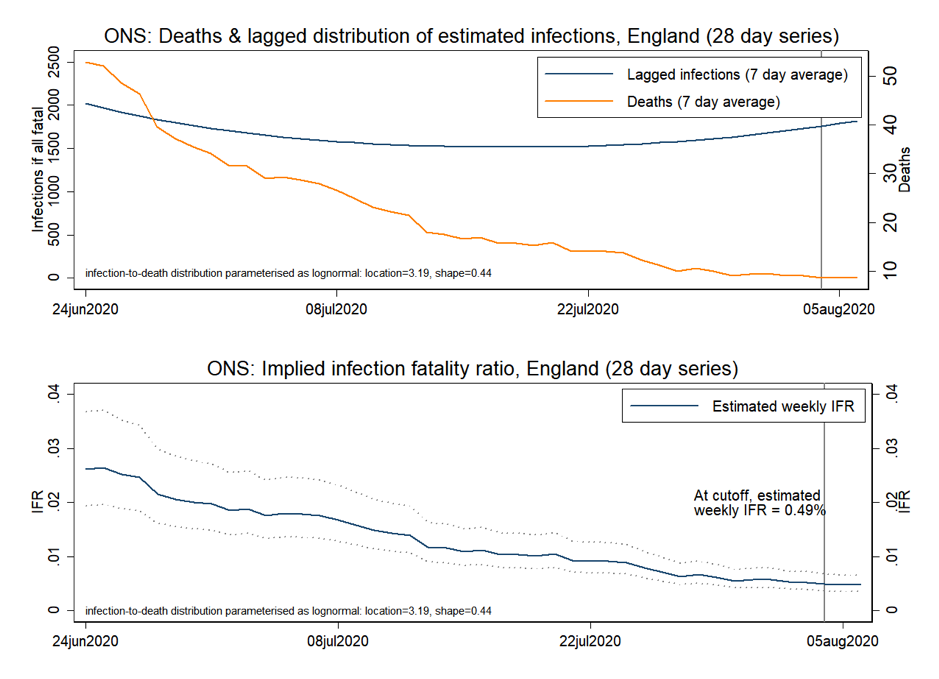
FIG 3A. DEATHS, LAGGED INFECTIONS AND INFECTION FATALITY RATIO TRENDS (ONS DATA), ENGLAND (SOURCE: CENTRE FOR EVIDENCE-BASED MEDICINE).
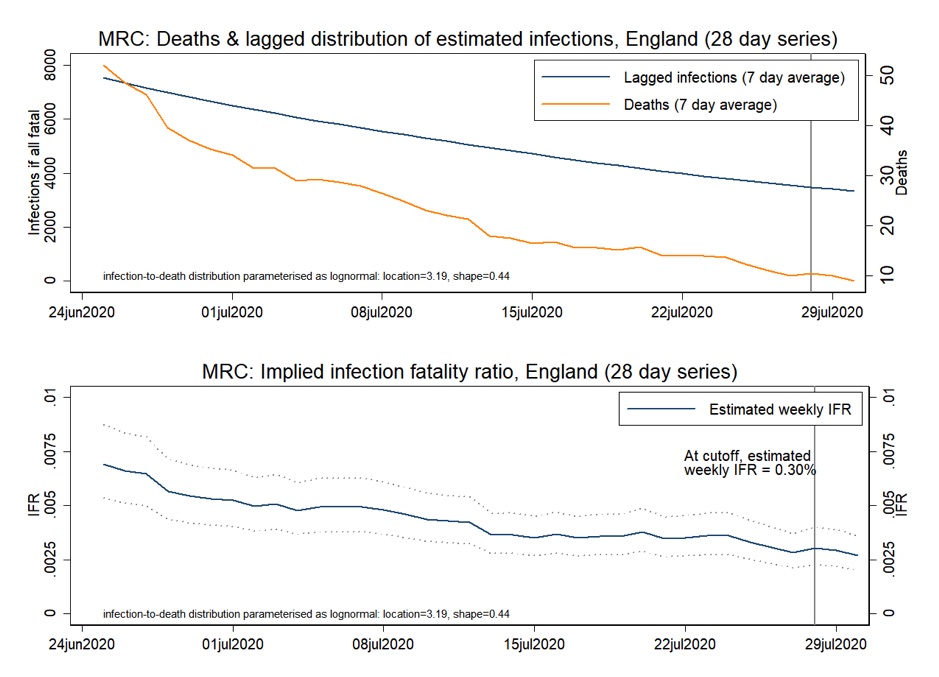
FIG 3B. DEATHS, LAGGED INFECTIONS AND INFECTION FATALITY RATIO TRENDS (MRC DATA), ENGLAND (SOURCE: CENTRE FOR EVIDENCE-BASED MEDICINE).
Wrap up
This analysis would suggest a scenario that is in almost diametric opposition to that which we're hearing on the mainstream media and from many governments, such as the UK's. Let's also not forget that while there's been a view portrayed that the pandemic has hit most of the world, especially countries in northern temperate latitudes, hard. let's not forget that the pandemic had little or no impact on all-cause mortality in Norway, Finland, Denmark, Austria and all the Eastern European countries.
Based on concerns of a second wave in Britain, Boris Johnson's government yesterday banned public gatherings of more than 6 people, making protests a bit harder to organise - or at least expensive if you don't mind maying the £100 fine for the first offence (fines rise to £3200 for successive offences).
For those planning to get married - that's still OK. But only if you observe the new guidance. Be warned, though. You'll need to wear a mask, you can't kiss your new spouse, you can have a disco but you're not allowed to dance - and everyone must stay 2 metres apart. Sounds like a heap of fun (not!). And maybe completely unnecessary.
If we could follow the Swedes - and be given the right to exercise our freedoms to meet, dance or marry as we choose, we might be a whole lot better off - and out the other side of the pandemic a whole lot quicker. Just maybe.
Let's keep a sharp eye on those data in the coming days and weeks and we'll see ◉_◉.
Find out more on our Covid Adapt Don't Fight campaign page.


Comments
your voice counts
17 September 2020 at 2:44 pm
You analysis certainly fits with my own instincts of what has and is going on. It may be worth adding the "dry tinder" theory. Many of the worst affected countries had also experienced very mild flu seasons in previous years. The, unfortunately, appears to have created a large population pool that was especially vulnerable to a flu-like virus. Which may well explain why the elderly population experienced such an initially high mortality rate.
Your voice counts
We welcome your comments and are very interested in your point of view, but we ask that you keep them relevant to the article, that they be civil and without commercial links. All comments are moderated prior to being published. We reserve the right to edit or not publish comments that we consider abusive or offensive.
There is extra content here from a third party provider. You will be unable to see this content unless you agree to allow Content Cookies. Cookie Preferences