
Content Sections
The following video was immediately pulled from YouTube when uploaded this afternoon for the following alleged reason:
"YouTube doesn't allow content that explicitly disputes the efficacy of local health authority or World Health Organization (WHO) guidance on social distancing and self isolation that may lead people to act against that guidance." It is now playing from Vimeo. We don't mention either social distancing or self isolation in the video.
The Video
Transcript
Hi there – my name’s Rob Verkerk – welcome to our latest coronacast, coronacast 9. In it we’re going to be taking a closer look at the confusion around government statistics, focusing especially on those used by the UK government
The United Nations tells us “The coronavirus COVID-19 pandemic is the defining global health crisis of our time and the greatest challenge we have faced since World War Two.”
If we accept this, and also accept there’s now evidence that social distancing, lockdowns, working from home and wearing masks significantly reduce hospitalisations and deaths, there’d be at least some justification to put us once again under lockdown, a particular form of house arrest.
Here’s how, Lord Jonathan Sumption, a former and eminent supreme court judge, describes our current predicament:
As we, here in the UK, prepare to go under house arrest once again this Thursday, let’s look at some of the government’s own data that underpin this draconian decision that will inevitably result in another surge of businesses going under, suicides and mental illness, and potentially crippling impacts on the economy.
How dangerous COVID-19?
If we forget for a minute that we still don’t know how many people have died of Covid – and consider only those who’ve died with Covid as the Government does, we need to be aware that for September, the most recent data for which there is publicly accessible data, Covid-19 ranked just 19th in the leaderboard of leading causes of death in England. It was ranked 24th the month prior, in August. We await the data for October, which will inevitably see an upturn – but we’ll still be unlikely to be able to decipher how much of this is actually caused primarily by SARS-CoV-2, rather than being people who died who also tested positive within 28 days of their death.
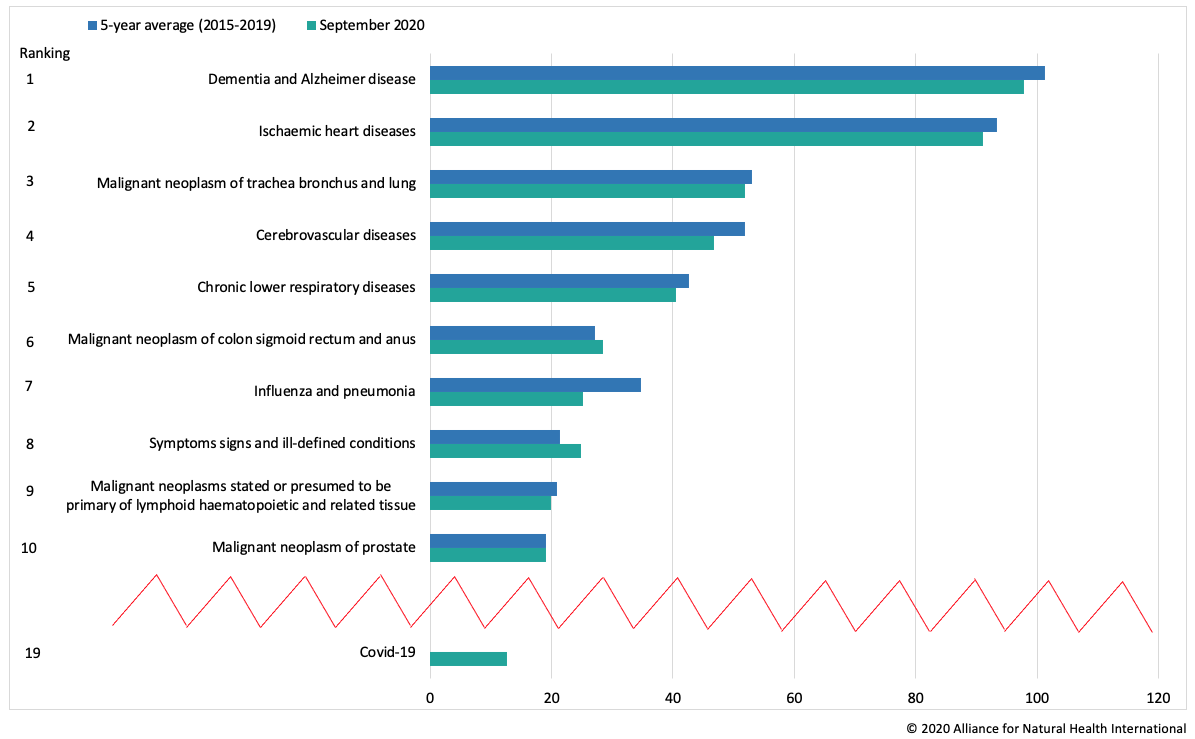
Fig 1: Leading causes of deaths in England in September 2020
Data source: Office for National Statistics
By comparison, chronic lower respiratory diseases, and then influenza and pneumonia, ranked 5th and 7th respectively, both of these sharing many of the symptoms that are also common to the disease in 19th place that’s brought the country to its knees.
We have to ask ourselves why do we accept so much collateral damage through our myopic reaction to one disease that may not even make it into the top 10 list of killer diseases by the end of the year? What if we were to do the same thing for another disease? And why haven’t we done anything as radical as this for influenza and pneumonia in the past, given both are communicable diseases caused by viruses or bacteria that get passed to people in close proximity with each other?
You’ll remember earlier this year when we went into lockdown the first time round, it was all about protecting the NHS and preventing health services being overrun.
Well the picture here tells us something that’s quite at odds with what the Government’s been saying – yet this figure relies on their data.
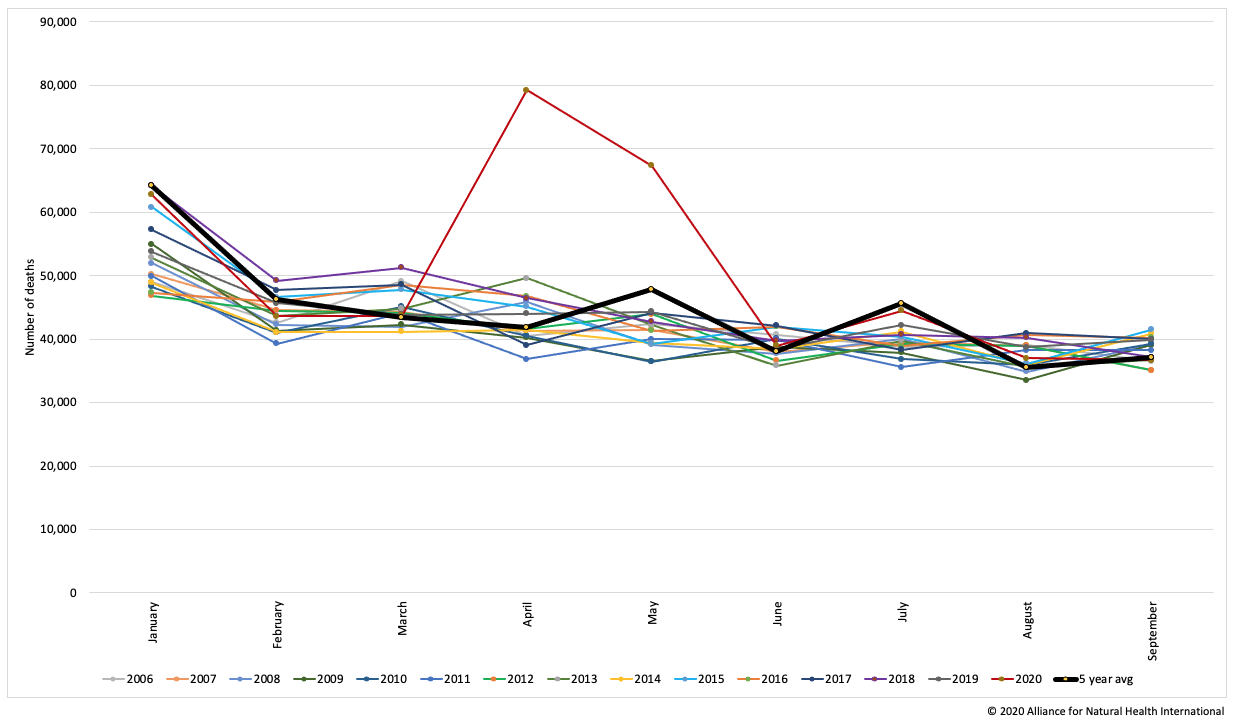
Fig 2: Mortality rates England & Wales. 2006 - September 2020
Data source: Office for National Statistics (ONS)
The graph is based on data from the Office of National Statistics and it shows – with a red line – all the deaths from January through to the end of September in 2020. All the other lines show the same time period for all the years from 2006 through to 2019. You can see the clear excess of deaths compared with the other years that occurred between March and June 2020 – something quite unique in recent time and obviously deeply tragic for the families and friends affected.
But as we’ll see in a minute, the vast majority of these deaths were among those who were elderly with underlying conditions who would have likely died relatively soon even without SARS-CoV-2. What we’ve seen is in effect a concertinaing of deaths.
But there’s something else that’s important about this graph. Look at the right side of it. You’ll see that since June – there’s been nothing to speak about that’s different from any other year. Yet, the country has been able to do little else than wallow in a state of fear, preparing itself for the next lockdown that was sold to us as an inevitability by the Government and the well-healed mainstream media.
Where did the dead die?
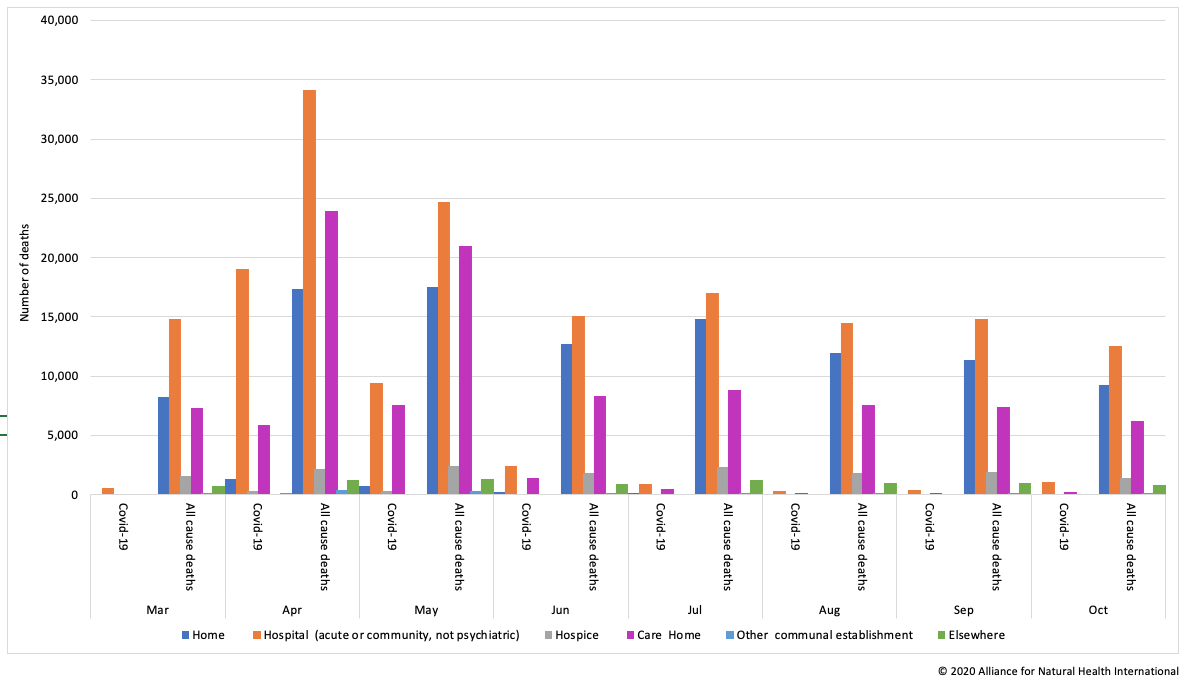
Fig 3: Weekly provisional figures on deaths registered where coronavirus (COVID-19) was mentioned on the death certificate, by place of occurrence, in England and Wales
Data source: Office for National Statistics (ONS)
Most people who died in 2020 in England and Wales, died in hospitals, not necessarily getting the best care known to science or medicine. Many early on were put on ventilators before it was realised they do more than good for most people with Covid. Often people’s immune systems were not working properly because they were deeply depleted of essential nutrients like vitamins D, C and zinc. Next in line were people dying in their homes, then in care homes – but this pattern is typical of people who die of all kinds of respiratory infections in other years.
Whichever way you look at the data, the death toll associated with Covid-19 in hospitals and carehomes was bad in April and May. But the fact is – it’s been trivial compared with other causes of death since June. And it remains that way.
How close were hospitals to being overwhelmed during the first lockdown?
The simple answer to this question is not close at all. Even before extra capacity was created through the construction of the Nightingale hospitals, there was always space, especially given that the Covid wave of March and April came after the worse of the normal winter surge from respiratory infections including flu and pneumonia.
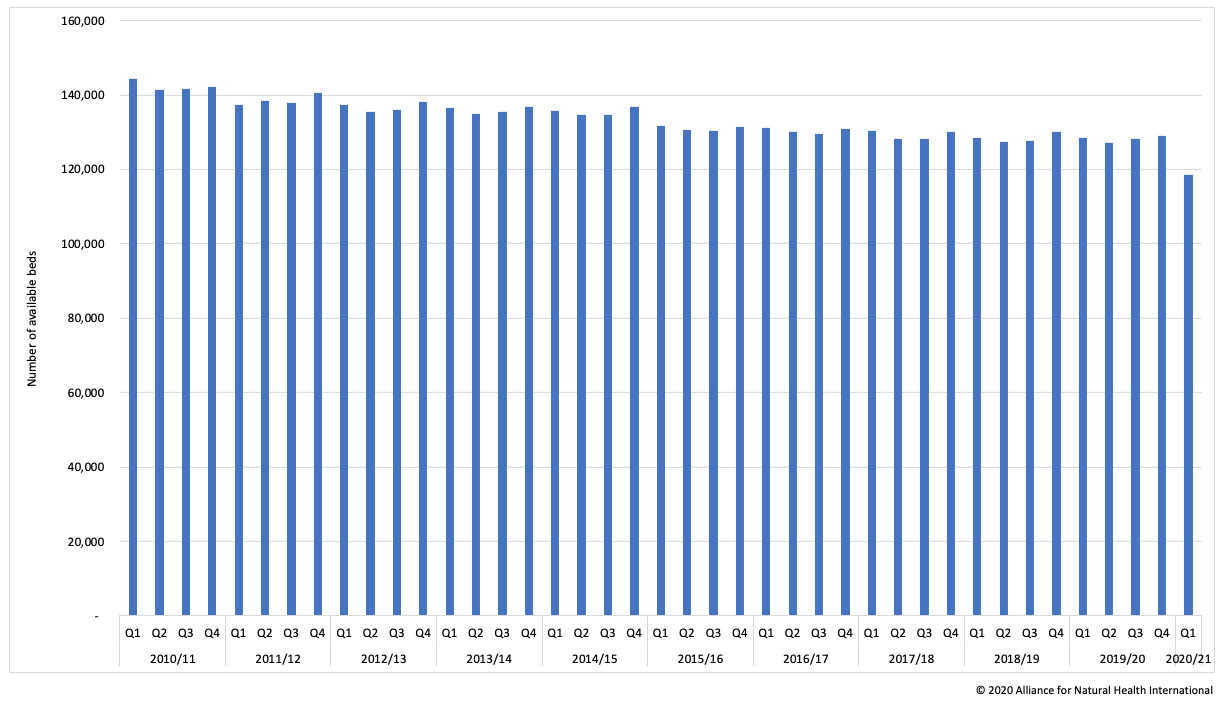
Fig 4: Average Daily Available Beds. 2010/11 - Q1 2020/21
Data source: NHS England
As this graph shows here, there were consistently between 120,000 and 140,000 hospital beds available from 2010 through to the first quarter of 2020, when the primary wave of infection hit. And despite the predictions, hospitals were nowhere near to being overwhelmed.
Moving on to this autumn and the impending winter – while numbers are ramping up in British hospitals – the number of beds in critical care – are in line with other years – as you can see here in this latest graphic from the Daily Telegraph.
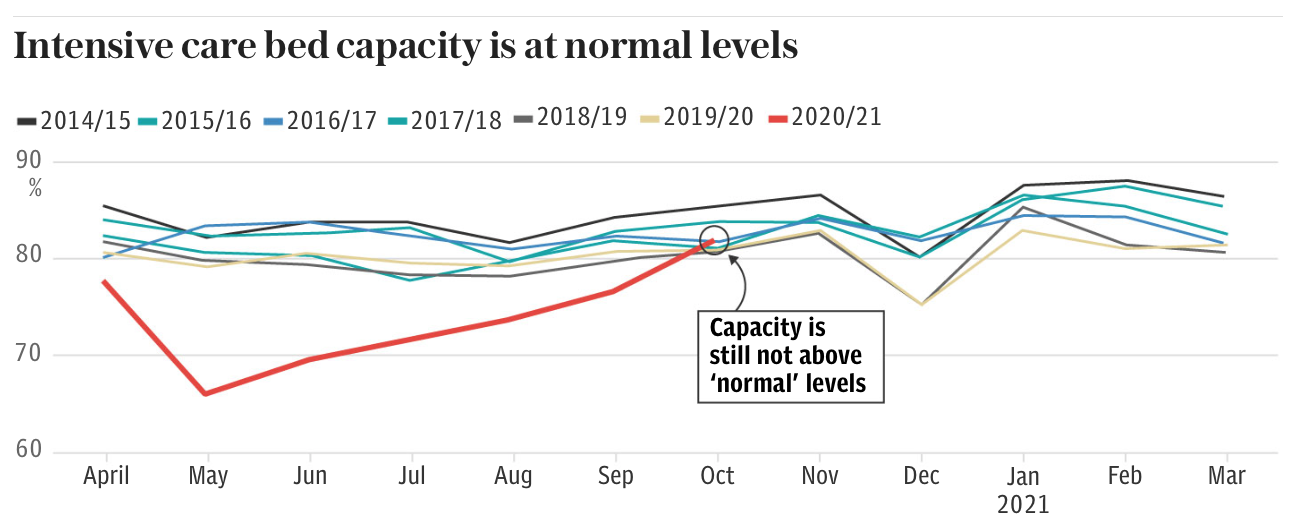
Fig 5: ICU bed capacity
Data source: Daily Telegraph
And now to a pretty fundamental and key point that’s far from a favourite topic of discussion with governments. The fact that a lot of people are testing positive doesn’t mean they’re being hospitalised because of the danger Covid-19 disease poses to them.
As we and many others have said before, the PCR test is flawed.
It simply amplifies a specific sequence of the virus and tells you nothing about whether that sequence is linked to a virus that’s active, transmissible and can cause serious illness or death. That all-important ‘read-across’ is simply not there – and we’ve never before classified illness only on the basis of the presence of a gene sequence. Usually we define diseases according to specific symptoms and described patterns of pathogenesis. Right now, the Government is being very cagey with data – and it has yet to put clear information into the public domain that explains the underlying reasons for hospitalisation.
In fact, it’s positively interfered with the sharing of data as you can see here in the case of Manchester hospitals.
Will whole city testing in liverpool work or backfire?
The army is also now being mobilised in Liverpool to roll out the first whole city testing programme anywhere in the UK using both a flawed testing and a flawed disease classification process. That means they plan to test everyone, regardless of who you are, your age, locality, risk of disease or your state of health. Liverpool’s been chosen as a testing ground for a plan that’s being considered nationwide because it’s claimed to be one of the country’s worst Covid hotspots.
This next round of lockdowns will now further decimate lives, livelihoods and economies. More people won’t get the care they need because healthcare systems have been so myopically focused on one disease for the last three quarters of a year.
But what’s really going on in Liverpool?
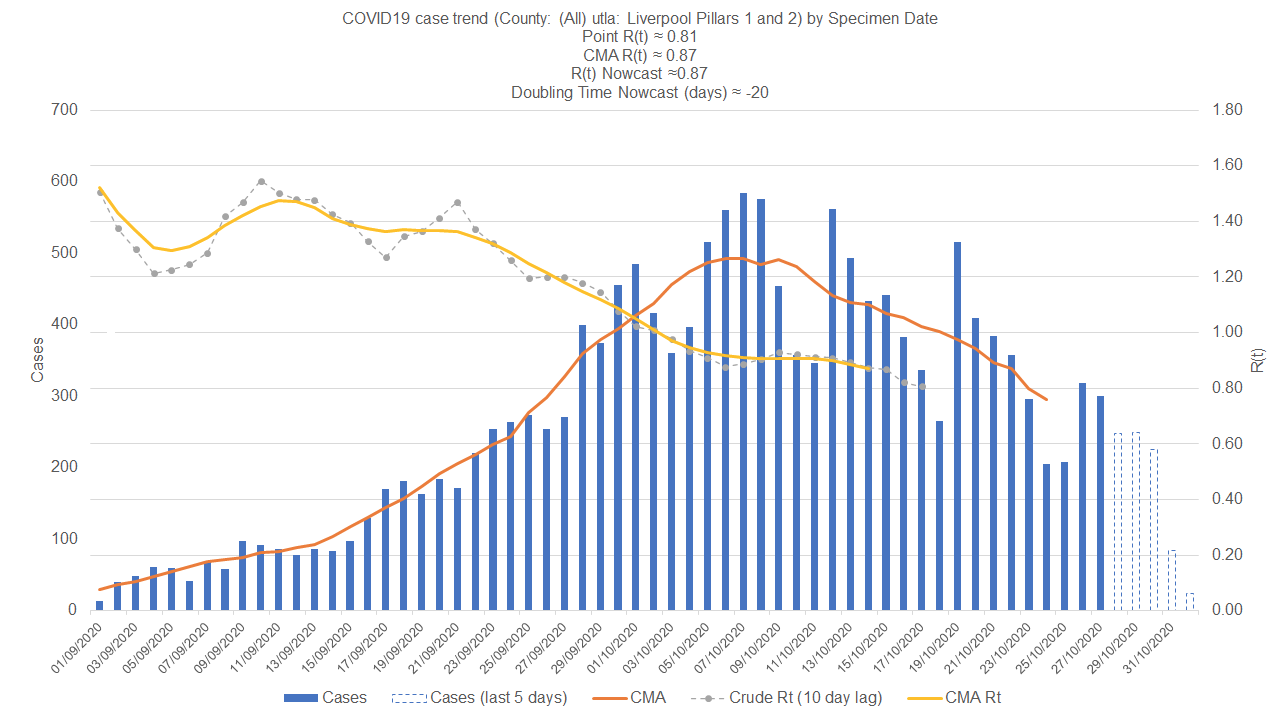
Fig 6: Data source - https://pbs.twimg.com/
The Liverpool data show that even so-called ‘cases’ of Covid-19 based on testing are going down – and there’s conflicting information in the media as to whether hospitals in the area are close to capacity or not. But bear in mind this is the time of year when most hospitals face the greatest pressure from increases in respiratory infections among older and immune compromised patients, regardless.
Will more positive tests – inevitably including a large number of false positives – lead to the people of Merseyside having even more of their rights stripped from them? Will their fate be used as reason to lock them down even harder?
Do lockdown work?
One way of finding out whether lockdowns work is by looking at what happened to Covid-related deaths in different countries or regions that enacted different degrees of severity of lockdown or other restrictive measures.
Here we take international data sets collated by Worldometer and look at rates of severe disease and death related to covid.
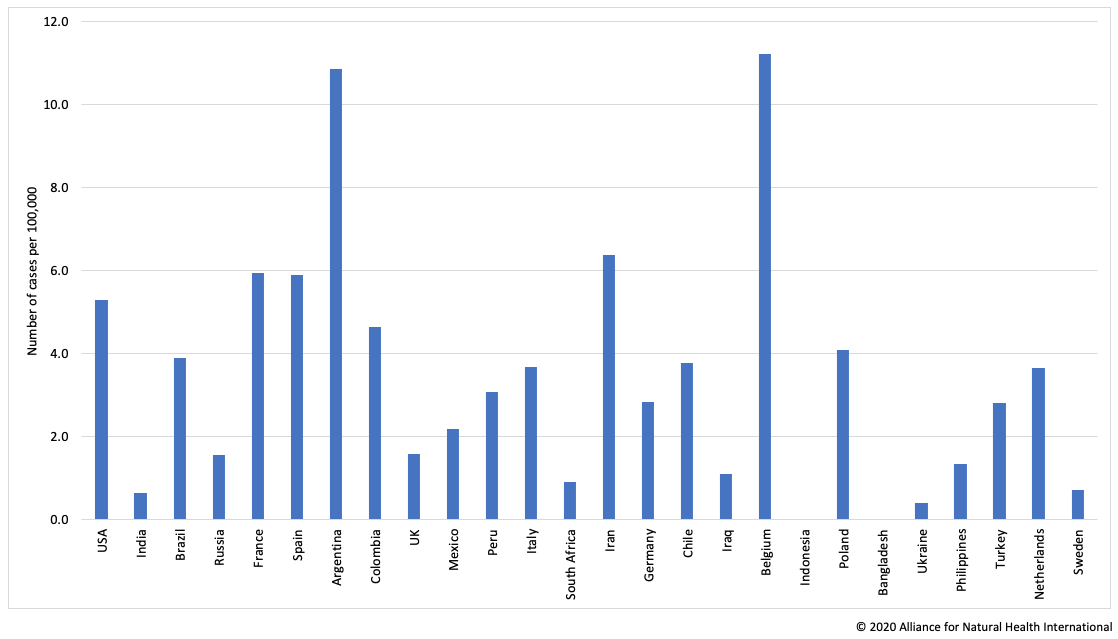
Fig 7a: Total coronavirus serious/critical cases per 100,000
Data source: Worldometer
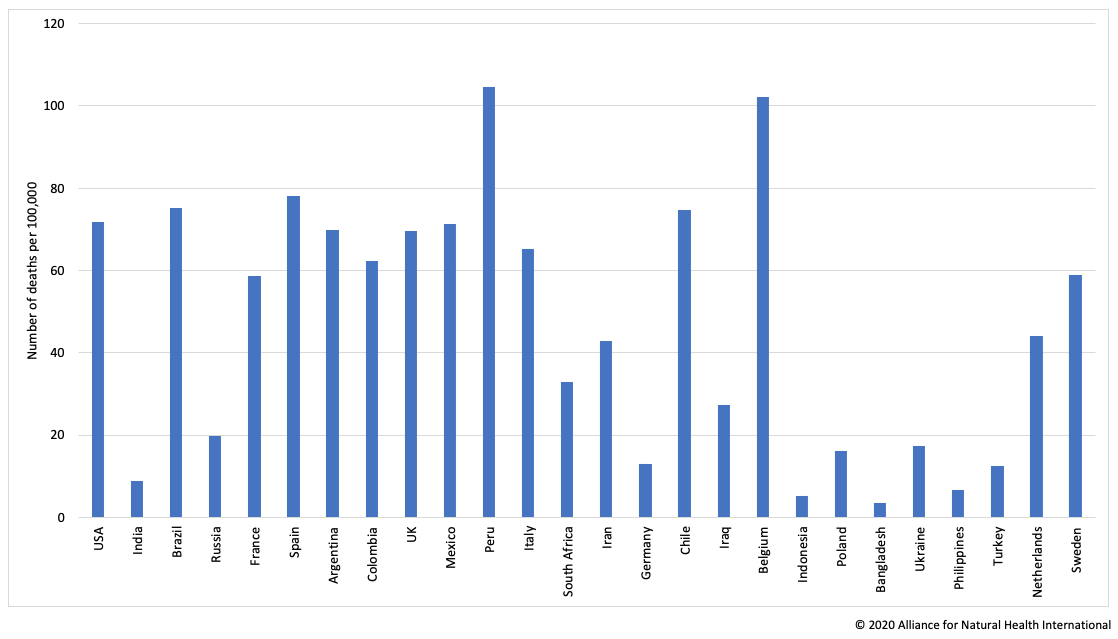
Fig 7b: Total coronavirus related deaths per 100,000
Data source: Worldometer
You’ll see there’s precious little evidence that countries with severe lockdowns have fared better than those who used a more hands-off approach. The three countries with the, so far, highest death rate per capita, Peru, Belgium and Spain, all locked down very hard. Sweden was heavily criticised for its light and voluntary lockdown approach that spared its economy did slightly better than Italy or Spain – and is on par with France – these three other European countries were praised for the rigour of their lockdowns and clearly playing the game.
President Bolsonaro in Brazil was widely lambasted for his laissez-faire approach, while President Piñera of Chile has been accepted. Their per capita death rates are more or less the same, regardless.
It seems that whatever humans try to do to stop transmission through lockdowns and social distancing, like every respiratory virus before it, this one will do its own thing. And it may be there are a bunch of other factors that affect it more than human attempts to break the transmission cycle. Such as the number of cases that kicked it off in a given country, what groups became infected, in what kinds of conditions they were located, what their underlying health was, what the climate and seasons are doing – and so forth.
Governments seem to think they can control the virus – pragmatic evidence suggests otherwise.
Why is dialogue being shut down
Whatever our differences of views, based on the huge, varied and variable data quality we’re able to access, there’s one thing that normally helps us resolve things. It’s called dialogue. But the concerted effort around the world to shut down conversations and dialogue that’s at odds with the masterplan being enacted by governments and controlled by intergovernmental and non-governmental organisations such as the United Nations and its various agencies like the WHO and UNDP, the World Economic Forum, the International Monetary Fund and others, is – wait for it – unprecedented.
If you don’t toe the party line, you get shut down, censored or marginalised.
In the UK, like in many other countries, it seems the Government will do what it wants by simple decree, without good reason, without scientific dialogue, and with barely any consultation with Parliament, the bedrock of the democratic system that’s existed since the signing of the Magna Carta in 1215.
The Magna Carta was described by the eminent Lord Tom Denning back in 1956 as "the greatest constitutional document. Yet these rights, that have been central to liberty for 800 years, have been withdrawn in just 8 short months.
In the quagmire of misinformation, censorship and restrictions in which we now exist, there’s one thing we can probably all agree on. People across the world are deeply divided. It’s as if we are at a juncture in which those with different values are incapable of seeing eye to eye with each other – and now are forbidden to enter into conversation.
But as evolutionary biologist Bret Weinstein said the other day from his home in Portland (Oregon), we’re one species on a piece of rock, orbiting a star. If we’ve got differences, we better learn to talk to each other. It’s the only way we’re going to sort things out – it’s the only way we ever have done.
If there’s just two things we should be asking of governments, the media and the tech platforms who’ve assumed control over our lives and our hard-won rights over the last 8 months – it’s to be accountable for any decisions that restrict our freedoms, and allow dialogue and conversation so that the many divergent voices can be heard.
Let’s hear each other’s differences, not bury them.
That way, at least, we’ll be less likely to be exposed to lies, damned lies and manipulated statistics.
Only with transparency, as well as accurate and balanced information about the world around us, can we help to shape a future we’d be proud of handing over to the next generation.
>>> Visit the ANH-Intl Covid Zone


Comments
your voice counts
07 November 2020 at 12:02 am
Thank you for information given in a calm, non sensationalist way. Your facts confirm my belief that we are being lied to and manipulated through fear via mainstream media and the government. But other than reposting articles and info ourselves it feels that we are totally powerless
07 November 2020 at 8:46 am
Governments seem to think they can control the virus?
Well the PR is framed in such terms, as a way to protect the fear that feeds the control that draws the funding and allegiance for the imposition of defences that DO the harm they purport to protect against.
But insofar as the virus is a codeword for us - the living. They are 'coming out' of any closet of pretence to real relationship as the intent to force life and the living to conform and comply - globally and locally - right down to cellular biology of gene hacking experimentation.
What could possibly go right?
Coming out as a human being is an unmasking both within ourselves and to each other.
The underlying theme of fear, coercion and control is altogether rooted in deceit or self-illusion and regardless of circumstances this does come within our realm of responsibility for our consciousness, for our life as a true with-ness in true worth-ship.
Dissociation is a mind set within something else called judgement. We make a world from judgement we cover over the presence of life with meanings by which a sense of possession and control operate as if independently or autonomously rather than as an expression of wholeness. It is my sense that we have normalised an un-natural mind such as to be invisibly structured by its framing, and yet in the breakdown of the capacity to maintain its masking, are the underlying fears, beliefs and controls revealing themselves to many as clearly mad, or reversed thinking - in which effects are falsely flagged as 'cause' and true cause is hidden by fear, as if to save or protect us from knowing what we do.
The desire to know and be known in truth is alive.
The masking against fear of being known and rejected is judgement.
The warning that comes with the tool 'judgement' is that to us it, is to be used by it.
We set up the measure of our own receipt - but know not what we do.
Awareness is a field of knowing that mental derivatives substitute for and rule out such as to make our being - or the messengers of our being, seem to be the threat to our image or model of reality - in which the illusion of possession and control is played out as a dispossession to an uncontrollable chaos - for it becomes the very means we set against it.
True order is rooted in the heart of an honest decision, aligned with wholeness.
We can become partial to our own invested self-illusion, so as to give it the defences and allegiance due unto That which gives life as true meaning uncovered. As healing uncovered from dissociated thinking framed in conflict.
My sense is the need to recognise such mind-framing and choose NOT to give support and allegiance to it as a currency of exchange and allegiance, so as to give witness and with-ness to our Human being. For we are truly moved and can discern and align there if we release our mind from the reactive justification of an old normalised conditioning.
"Let me be an instrument of Thy Peace" asks for no more than to serve and align in wholeness of being - or to know our purpose and live it. The belief we must hide our true desire is our fear of it, and our masking in substitutions.
The Mask is 'rising from the Deep' as the revealing of us to ourselves in who we are not but fear to be.
So much hate and fear, yet the tares have grown alongside the true harvest all along.
Your voice counts
We welcome your comments and are very interested in your point of view, but we ask that you keep them relevant to the article, that they be civil and without commercial links. All comments are moderated prior to being published. We reserve the right to edit or not publish comments that we consider abusive or offensive.
There is extra content here from a third party provider. You will be unable to see this content unless you agree to allow Content Cookies. Cookie Preferences